
NetSTREIT Corp. (NTST): Price and Financial Metrics
NTST Price/Volume Stats
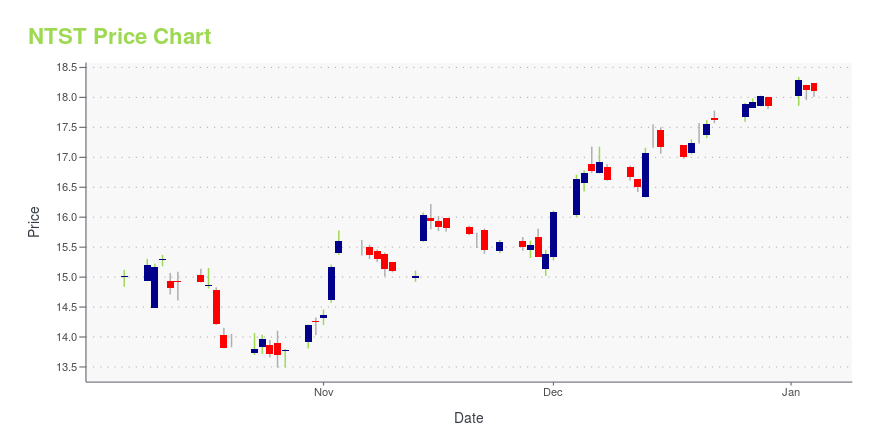
| Current price | $17.00 | 52-week high | $18.97 |
| Prev. close | $17.02 | 52-week low | $13.49 |
| Day low | $16.99 | Volume | 1,445,800 |
| Day high | $17.26 | Avg. volume | 1,119,802 |
| 50-day MA | $17.26 | Dividend yield | 4.73% |
| 200-day MA | $16.88 | Market Cap | 1.25B |
NTST Stock Price Chart Interactive Chart >
NetSTREIT Corp. (NTST) Company Bio
NetSTREIT Corp. operates as a real estate investment trust (REIT) that engages in the acquisition and management of portfolio of single-tenant, retail commercial real estate subject to long-term net leases. The firm specializes in acquiring single-tenant net lease retail properties nationwide. The company was founded on December 23, 2019 and is headquartered in Dallas, TX.
Latest NTST News From Around the Web
Below are the latest news stories about NETSTREIT CORP that investors may wish to consider to help them evaluate NTST as an investment opportunity.
Analysts Slashing Price Targets During A Quiet WeekThanksgiving week is usually quiet yet positive for stocks, and 2023 was no exception. Still, despite recent gains in the real estate investment trust (REIT) sector, analysts were busy sharpening their Thanksgiving knives this week on the price targets of several REITs. Take a look at four REITs whose current ratings were maintained this week but still experienced significant carvings on their price targets. NetSTREIT Corp. (NYSE:NTST) is a Dallas-based retail REIT with 547 properties across 45 |
NETSTREIT Corp. (NYSE:NTST) Q3 2023 Earnings Call TranscriptNETSTREIT Corp. (NYSE:NTST) Q3 2023 Earnings Call Transcript October 26, 2023 Operator: Greetings and welcome to the NETSTREIT Third Quarter 2023 Earnings Call. [Operator Instructions]. As a reminder, this conference is being recorded. It is now my pleasure to introduce your host, Amy An, Director of Investor Relations. Thank you. You may begin. Amy An: […] |
Q3 2023 Netstreit Corp Earnings CallQ3 2023 Netstreit Corp Earnings Call |
Compared to Estimates, NETSTREIT (NTST) Q3 Earnings: A Look at Key MetricsWhile the top- and bottom-line numbers for NETSTREIT (NTST) give a sense of how the business performed in the quarter ended September 2023, it could be worth looking at how some of its key metrics compare to Wall Street estimates and year-ago values. |
NETSTREIT (NTST) Q3 FFO Match EstimatesNETSTREIT (NTST) delivered FFO and revenue surprises of 0% and 5.41%, respectively, for the quarter ended September 2023. Do the numbers hold clues to what lies ahead for the stock? |
NTST Price Returns
| 1-mo | -7.46% |
| 3-mo | -5.89% |
| 6-mo | 22.80% |
| 1-year | -2.02% |
| 3-year | -8.04% |
| 5-year | N/A |
| YTD | -3.62% |
| 2023 | 2.13% |
| 2022 | -16.77% |
| 2021 | 21.92% |
| 2020 | N/A |
| 2019 | N/A |
NTST Dividends
| Ex-Dividend Date | Type | Payout Amount | Change | ||||||
|---|---|---|---|---|---|---|---|---|---|
| Loading, please wait... | |||||||||
Loading social stream, please wait...