
Nu Skin Enterprises, Inc. (NUS): Price and Financial Metrics
NUS Price/Volume Stats
| Current price | $6.33 | 52-week high | $14.00 |
| Prev. close | $6.06 | 52-week low | $5.32 |
| Day low | $5.95 | Volume | 652,827 |
| Day high | $6.34 | Avg. volume | 737,131 |
| 50-day MA | $7.07 | Dividend yield | 4.11% |
| 200-day MA | $7.54 | Market Cap | 314.75M |
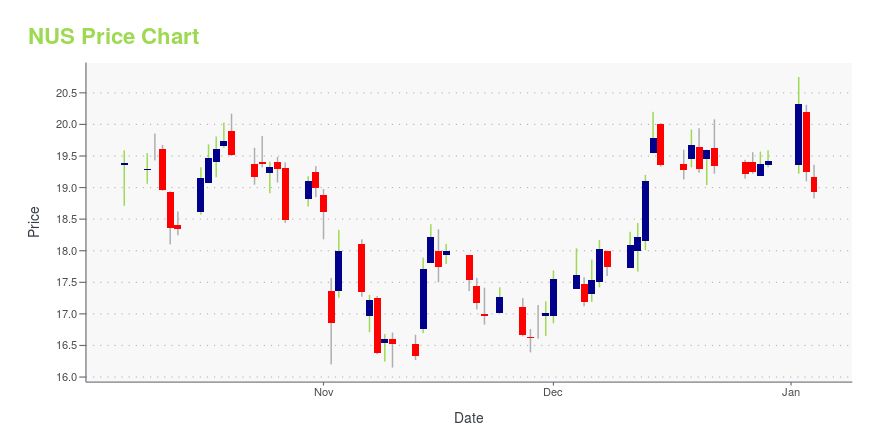
NUS Stock Price Chart Interactive Chart >
Nu Skin Enterprises, Inc. (NUS) Company Bio
Nu Skin Enterprises develops and distributes anti-aging personal care products and nutritional supplements under the Nu Skin and Pharmanex brands worldwide. The company was founded in 1984 and is based in Provo, Utah.
NUS Price Returns
| 1-mo | -12.81% |
| 3-mo | -7.93% |
| 6-mo | 1.43% |
| 1-year | -44.71% |
| 3-year | -83.27% |
| 5-year | -72.16% |
| YTD | -7.40% |
| 2024 | -63.67% |
| 2023 | -51.07% |
| 2022 | -13.92% |
| 2021 | -4.32% |
| 2020 | 38.67% |
NUS Dividends
| Ex-Dividend Date | Type | Payout Amount | Change | ||||||
|---|---|---|---|---|---|---|---|---|---|
| Loading, please wait... | |||||||||
Continue Researching NUS
Here are a few links from around the web to help you further your research on Nu Skin Enterprises Inc's stock as an investment opportunity:Nu Skin Enterprises Inc (NUS) Stock Price | Nasdaq
Nu Skin Enterprises Inc (NUS) Stock Quote, History and News - Yahoo Finance
Nu Skin Enterprises Inc (NUS) Stock Price and Basic Information | MarketWatch
Loading social stream, please wait...