Nu Skin Enterprises, Inc. (NUS): Price and Financial Metrics
GET POWR RATINGS... FREE!
NUS POWR Grades
- NUS scores best on the Quality dimension, with a Quality rank ahead of 94.87% of US stocks.
- NUS's strongest trending metric is Stability; it's been moving down over the last 179 days.
- NUS ranks lowest in Momentum; there it ranks in the 2nd percentile.
NUS Stock Summary
- NUS's current price/earnings ratio is 55.28, which is higher than 89.51% of US stocks with positive earnings.
- In terms of twelve month growth in earnings before interest and taxes, NU SKIN ENTERPRISES INC is reporting a growth rate of -72.81%; that's higher than just 18.3% of US stocks.
- As for revenue growth, note that NUS's revenue has grown -14.21% over the past 12 months; that beats the revenue growth of merely 11.12% of US companies in our set.
- If you're looking for stocks that are quantitatively similar to NU SKIN ENTERPRISES INC, a group of peers worth examining would be KELYA, EYE, XPEL, JJSF, and MIXT.
- Visit NUS's SEC page to see the company's official filings. To visit the company's web site, go to www.nuskin.com.
NUS Valuation Summary
- In comparison to the median Consumer Defensive stock, NUS's price/sales ratio is 5.26% lower, now standing at 0.9.
- Over the past 243 months, NUS's price/earnings ratio has gone up 36.4.
Below are key valuation metrics over time for NUS.
Stock | Date | P/S | P/B | P/E | EV/EBIT |
---|---|---|---|---|---|
NUS | 2023-01-18 | 0.9 | 2.4 | 53.1 | 27.0 |
NUS | 2023-01-17 | 0.9 | 2.5 | 54.0 | 27.4 |
NUS | 2023-01-13 | 0.9 | 2.5 | 53.8 | 27.4 |
NUS | 2023-01-12 | 0.9 | 2.5 | 54.9 | 27.9 |
NUS | 2023-01-11 | 0.9 | 2.5 | 55.0 | 27.9 |
NUS | 2023-01-10 | 0.9 | 2.6 | 56.7 | 28.7 |
NUS Growth Metrics
- Its 4 year price growth rate is now at -35.4%.
- The 3 year net cashflow from operations growth rate now stands at -14.15%.
- Its 5 year price growth rate is now at -35.4%.

The table below shows NUS's growth in key financial areas (numbers in millions of US dollars).
Date | Revenue | Operating Cash Flow | Net Income to Common Stock |
---|---|---|---|
2022-09-30 | 2,376.755 | 192.046 | 38.332 |
2022-06-30 | 2,480.102 | 193.819 | 113.451 |
2022-03-31 | 2,623.542 | 167.979 | 138.552 |
2021-12-31 | 2,695.669 | 141.582 | 147.266 |
2021-09-30 | 2,770.426 | 126.766 | 229.964 |
2021-06-30 | 2,832.621 | 214.919 | 236.542 |
NUS's Quality Factors
The “Quality” component of the POWR Ratings focuses on 31 different factors of a companies fundamentals and operational strength. Here are some key insights as we drill into the specifics of these quality attributes.- NUS has a Quality Grade of A, ranking ahead of 96.07% of graded US stocks.
- NUS's asset turnover comes in at 1.458 -- ranking 55th of 105 Wholesale stocks.
- SCHN, LKQ, and GPC are the stocks whose asset turnover ratios are most correlated with NUS.
The table below shows NUS's key quality metrics over time.
Period | Asset Turnover | Gross Margin | ROIC |
---|---|---|---|
2021-06-30 | 1.458 | 0.746 | 0.254 |
2021-03-31 | 1.458 | 0.744 | 0.243 |
2020-12-31 | 1.412 | 0.745 | 0.216 |
2020-09-30 | 1.357 | 0.750 | 0.180 |
2020-06-30 | 1.308 | 0.757 | 0.170 |
2020-03-31 | 1.315 | 0.758 | 0.178 |
NUS Price Target
For more insight on analysts targets of NUS, see our NUS price target page. And for a list of of all stocks sorted by upside potential based on analyst target price, see our Top Price Target page.
Average Price Target | $65.20 | Average Broker Recommendation | 1.7 (Moderate Buy) |
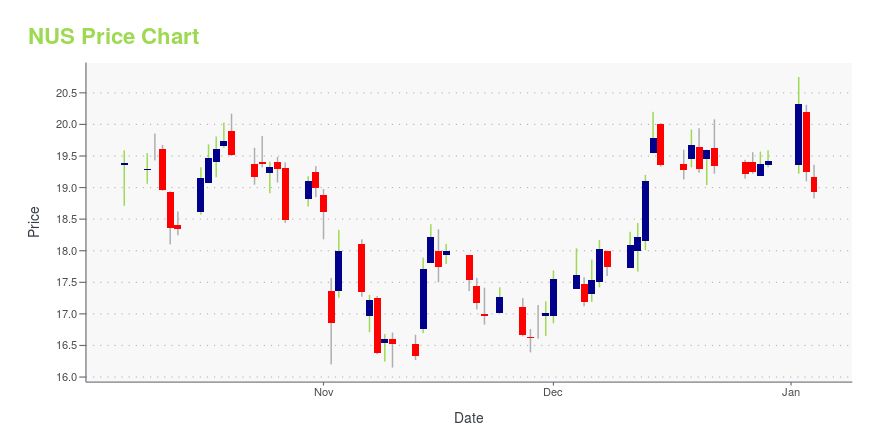
NUS Stock Price Chart Interactive Chart >
NUS Price/Volume Stats
Current price | $44.66 | 52-week high | $56.76 |
Prev. close | $44.28 | 52-week low | $29.95 |
Day low | $43.84 | Volume | 41,364 |
Day high | $44.66 | Avg. volume | 627,938 |
50-day MA | $41.65 | Dividend yield | 3.48% |
200-day MA | $41.66 | Market Cap | 2.21B |
Nu Skin Enterprises, Inc. (NUS) Company Bio
Nu Skin Enterprises develops and distributes anti-aging personal care products and nutritional supplements under the Nu Skin and Pharmanex brands worldwide. The company was founded in 1984 and is based in Provo, Utah.
Latest NUS News From Around the Web
Below are the latest news stories about NU SKIN ENTERPRISES INC that investors may wish to consider to help them evaluate NUS as an investment opportunity.
Nu Skin Reaches 800 Million Meals Purchased and Donated in its Fight Against Child MalnutritionNu Skin Enterprises, Inc. (NYSE: NUS), a leading beauty and wellness company, today announced it has reached the milestone of providing 800 million meals for children since 2002 through its Nourish the Children (NTC) initiative. Malnourished children in more than 65 countries around the world have been fed VitaMeal,* a nutrient-dense food, from one of NTC's third-party charity partners after Nu Skin sales leaders, customers or employees purchase and donate bags of food. |
Is Nu Skin Enterprises, Inc. (NYSE:NUS) Trading At A 22% Discount?Today we'll do a simple run through of a valuation method used to estimate the attractiveness of Nu Skin Enterprises... |
Nu Skin Enterprises to Announce Fourth Quarter and 2022 Financial ResultsNu Skin Enterprises, Inc. (NYSE: NUS) today announced it will release fourth quarter and full year 2022 results after the market closes on Wednesday, Feb. 15. The Nu Skin management team will host a conference call with the investment community later that same day at 5 p.m. ET. During the call, management will discuss recent results and upcoming business initiatives. |
11 Best Hair Care Stocks to Buy NowIn this article, we discuss 11 best hair care stocks to buy now. If you want to see more stocks in this selection, check out 5 Best Hair Care Stocks To Buy Now. The global hair care market is forecasted to expand at a compound annual growth rate of 6.6% over the next five years. […] |
Nu Skin Enterprises' (NYSE:NUS) earnings have declined over five years, contributing to shareholders 29% lossWhile not a mind-blowing move, it is good to see that the Nu Skin Enterprises, Inc. ( NYSE:NUS ) share price has gained... |
NUS Price Returns
1-mo | 5.70% |
3-mo | 32.07% |
6-mo | 4.99% |
1-year | -10.04% |
3-year | 47.11% |
5-year | -25.36% |
YTD | 5.93% |
2022 | -13.92% |
2021 | -4.32% |
2020 | 38.67% |
2019 | -30.98% |
2018 | -8.32% |
NUS Dividends
Ex-Dividend Date | Type | Payout Amount | Change | ||||||
---|---|---|---|---|---|---|---|---|---|
Loading, please wait... |
Continue Researching NUS
Here are a few links from around the web to help you further your research on Nu Skin Enterprises Inc's stock as an investment opportunity:Nu Skin Enterprises Inc (NUS) Stock Price | Nasdaq
Nu Skin Enterprises Inc (NUS) Stock Quote, History and News - Yahoo Finance
Nu Skin Enterprises Inc (NUS) Stock Price and Basic Information | MarketWatch
Loading social stream, please wait...