NVIDIA Corp. (NVDA): Price and Financial Metrics

NVIDIA Corp. (NVDA): $410.17

12.22 (-2.89%)

POWR Rating

Component Grades

Momentum

B

Stability

D

Sentiment

Quality

B

NVDA Price/Volume Stats

Current price $410.17 52-week high $502.66
Prev. close $422.39 52-week low $108.13
Day low $409.80 Volume 44,762,883
Day high $421.00 Avg. volume 49,243,539
50-day MA $453.99 Dividend yield 0.04%
200-day MA $313.72 Market Cap 1.01T

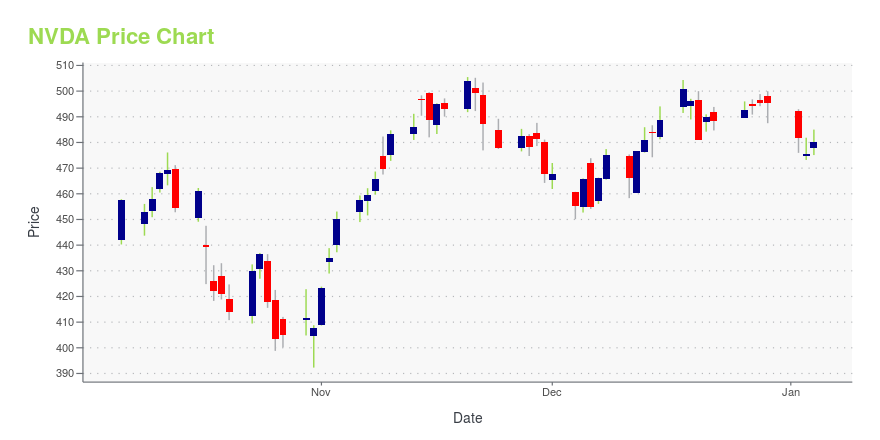
NVDA Stock Price Chart Interactive Chart >

NVDA POWR Grades

  • Sentiment is the dimension where NVDA ranks best; there it ranks ahead of 99.15% of US stocks.
  • The strongest trend for NVDA is in Quality, which has been heading up over the past 179 days.
  • NVDA's current lowest rank is in the Value metric (where it is better than 4.77% of US stocks).

NVDA Stock Summary

  • NVIDIA CORP's market capitalization of $1,085,960,200,000 is ahead of 99.9% of US-listed equities.
  • The price/operating cash flow metric for NVIDIA CORP is higher than 97.08% of stocks in our set with a positive cash flow.
  • With a price/sales ratio of 33.23, NVIDIA CORP has a higher such ratio than 95.73% of stocks in our set.
  • Stocks that are quantitatively similar to NVDA, based on their financial statements, market capitalization, and price volatility, are TSLA, META, AMZN, BRK.B, and LLY.
  • NVDA's SEC filings can be seen here. And to visit NVIDIA CORP's official web site, go to www.nvidia.com.

NVDA Valuation Summary

  • In comparison to the median Technology stock, NVDA's price/sales ratio is 1129.63% higher, now standing at 33.2.
  • NVDA's EV/EBIT ratio has moved up 56.8 over the prior 243 months.

Below are key valuation metrics over time for NVDA.

Stock Date P/S P/B P/E EV/EBIT
NVDA 2023-09-15 33.2 39.4 105.0 96.0
NVDA 2023-09-14 34.4 40.9 109.0 99.6
NVDA 2023-09-13 34.4 40.9 108.8 99.4
NVDA 2023-09-12 33.9 40.3 107.3 98.1
NVDA 2023-09-11 34.1 40.6 108.1 98.7
NVDA 2023-09-08 34.4 40.9 109.0 99.6

NVDA Growth Metrics

    The 5 year net income to common stockholders growth rate now stands at 69.68%.
  • Its year over year revenue growth rate is now at 53.41%.
  • Its year over year net cashflow from operations growth rate is now at 32.09%.
NVDA's revenue has moved up $14,552,000,000 over the prior 52 months.

The table below shows NVDA's growth in key financial areas (numbers in millions of US dollars).

Date Revenue Operating Cash Flow Net Income to Common Stock
2022-12-31 26,974 5,641 4,368
2022-09-30 28,566 6,426 5,957
2022-06-30 29,738 7,553 7,741
2022-03-31 29,541 8,965 9,459
2021-12-31 26,914 9,108 9,752
2021-09-30 24,274 8,142 8,207

NVDA's Quality Factors

The “Quality” component of the POWR Ratings focuses on 31 different factors of a companies fundamentals and operational strength. Here are some key insights as we drill into the specifics of these quality attributes.
  • NVDA has a Quality Grade of B, ranking ahead of 84.86% of graded US stocks.
  • NVDA's asset turnover comes in at 0.7 -- ranking 104th of 208 Electronic Equipment stocks.
  • STM, ITI, and SGH are the stocks whose asset turnover ratios are most correlated with NVDA.

The table below shows NVDA's key quality metrics over time.

Period Asset Turnover Gross Margin ROIC
2021-08-01 0.700 0.638 0.279
2021-05-02 0.690 0.624 0.245
2021-01-31 0.641 0.623 0.233
2020-10-25 0.638 0.626 0.270
2020-07-26 0.641 0.628 0.322
2020-04-26 0.662 0.635 0.431

NVDA Price Target

For more insight on analysts targets of NVDA, see our NVDA price target page. And for a list of of all stocks sorted by upside potential based on analyst target price, see our Top Price Target page.

Average Price Target $227.42 Average Broker Recommendation 1.45 (Moderate Buy)

NVIDIA Corp. (NVDA) Company Bio


Founded in 1993 by Jen-Hsun Huang, NVIDIA has focused on the development of the graphics processing unit (GPU) for a variety of devices -- primarily smartphones, personal computers, cars, and workstations. The company is headquartered in Santa Clara, California and operates in two official business segments: Graphics Processing Unit (GPU) and Tegra Processor. The GPU segment consists of solutions serving the mainstream computing and gaming markets, including products like the GeForce, Quadro, and Tesla series. The Tegra business segment consists of processor solutions designed to harness the power of the mobile/cloud and the artificial intelligence (AI) markets. NVIDIA's primary competitors include Advanced Micro Devices and Intel.  NVIDIA currently employs approximately 19,000 employees.


NVDA Latest News Stream


Event/Time News Detail
Loading, please wait...

NVDA Latest Social Stream


Loading social stream, please wait...

View Full NVDA Social Stream

Latest NVDA News From Around the Web

Below are the latest news stories about NVIDIA CORP that investors may wish to consider to help them evaluate NVDA as an investment opportunity.

Nvidia Vs Arm Stock: Dan Niles Picks A Side

Dan Niles picks Nvidia Corp over Arm stock as an AI play. He explained why today on CNBC's "Squawk Box Asia". Nvidia stock has lost more than 10% in recent weeks.

TalkMarkets.com | September 18, 2023

Is Nvidia’s Stock Price Forming Monster Bearish Reversal Pattern?

Nvidia closed in August right at its 161% Fibonacci extension level. And this month, NVDA has declined sharply.

TalkMarkets.com | September 18, 2023

China’s Struggles Shouldn’t Slow the Stock Market. Some Companies Look Riskier.

While only 5% of the aggregate revenue for companies in the benchmark comes from China,, the risk is higher for those with the biggest weightings.

Yahoo | September 18, 2023

Semiconductor Market Share By Company: Top 12

In this article, we will talk about the top 12 semiconductor market share by company. If you wish to skip our detailed analysis, you can go directly to the Semiconductor Market Share By Company: Top 5. Semiconductor Industry: An Overview Semiconductors are the prime element powering a multitude of products around us, ranging from automotive […]

Yahoo | September 18, 2023

These 7 Stocks Are Outperforming Nvidia In 2023

Nvidia stock has tripled, but it's not No. 1 in 2023. Carvana has surged 996%, leading seven huge winners this year.

Yahoo | September 18, 2023

Read More 'NVDA' Stories Here

NVDA Price Returns

1-mo -10.18%
3-mo -2.82%
6-mo 53.20%
1-year 209.49%
3-year 228.43%
5-year 528.11%
YTD 180.77%
2022 -50.26%
2021 125.44%
2020 122.30%
2019 76.94%
2018 -30.82%

NVDA Dividends

Ex-Dividend Date Type Payout Amount Change
Loading, please wait...
View Full NVDA Dividend History

Get Free Updates

Join thousands of investors who get the latest news, insights and top rated picks from StockNews.com!