Novartis AG ADR (NVS): Price and Financial Metrics
NVS Price/Volume Stats
Current price | $98.91 | 52-week high | $105.56 |
Prev. close | $97.11 | 52-week low | $74.09 |
Day low | $97.89 | Volume | 3,739,700 |
Day high | $98.93 | Avg. volume | 2,160,586 |
50-day MA | $98.41 | Dividend yield | 2.36% |
200-day MA | $88.00 | Market Cap | 209.65B |
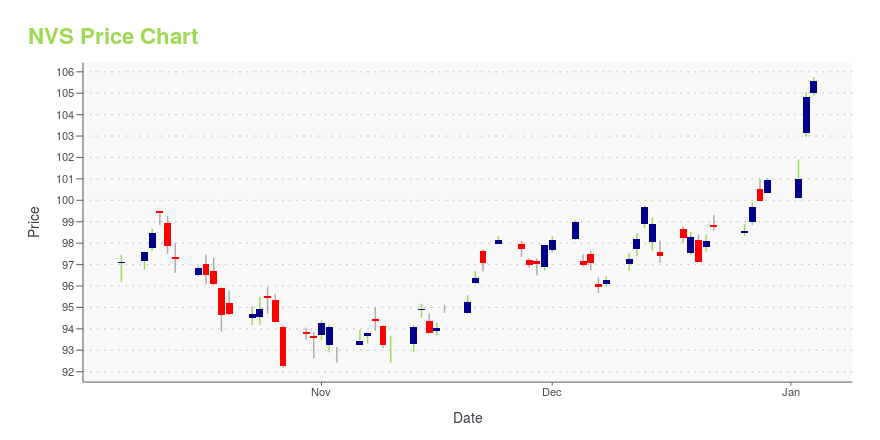
NVS Stock Price Chart Interactive Chart >
NVS POWR Grades
- Growth is the dimension where NVS ranks best; there it ranks ahead of 97.28% of US stocks.
- NVS's strongest trending metric is Growth; it's been moving up over the last 157 days.
- NVS ranks lowest in Momentum; there it ranks in the 16th percentile.
NVS Stock Summary
- NVS has a market capitalization of $209,762,910,000 -- more than approximately 99.31% of US stocks.
- In terms of twelve month growth in earnings before interest and taxes, NOVARTIS AG is reporting a growth rate of -65.83%; that's higher than merely 20.95% of US stocks.
- NOVARTIS AG's shareholder yield -- a measure of how much capital is returned to stockholders via dividends and buybacks -- is 9.58%, greater than the shareholder yield of 81.54% of stocks in our set.
- If you're looking for stocks that are quantitatively similar to NOVARTIS AG, a group of peers worth examining would be PFE, CSCO, ABBV, NFLX, and SAP.
- Visit NVS's SEC page to see the company's official filings. To visit the company's web site, go to www.novartis.com.
NVS Valuation Summary
- In comparison to the median Healthcare stock, NVS's price/sales ratio is 21.57% lower, now standing at 4.
- NVS's EV/EBIT ratio has moved up 8.4 over the prior 243 months.
Below are key valuation metrics over time for NVS.
Stock | Date | P/S | P/B | P/E | EV/EBIT |
---|---|---|---|---|---|
NVS | 2023-05-23 | 4.0 | 4.0 | 29.9 | 24.5 |
NVS | 2023-05-22 | 4.0 | 4.1 | 30.1 | 24.6 |
NVS | 2023-05-19 | 4.0 | 4.1 | 30.1 | 24.6 |
NVS | 2023-05-18 | 4.0 | 4.0 | 30.0 | 24.5 |
NVS | 2023-05-17 | 4.1 | 4.1 | 30.2 | 24.7 |
NVS | 2023-05-16 | 4.1 | 4.1 | 30.7 | 25.1 |
NVS Growth Metrics
- Its 2 year revenue growth rate is now at 6.14%.
- Its year over year net income to common stockholders growth rate is now at 204.01%.
- Its 2 year net cashflow from operations growth rate is now at 6.18%.

The table below shows NVS's growth in key financial areas (numbers in millions of US dollars).
Date | Revenue | Operating Cash Flow | Net Income to Common Stock |
---|---|---|---|
2022-12-31 | 51,828 | 14,236 | 6,955 |
2022-09-30 | 52,263 | 14,009 | 21,797 |
2022-06-30 | 52,788 | 14,213 | 22,982 |
2022-03-31 | 52,997 | 14,590 | 24,184 |
2021-12-31 | 52,877 | 15,071 | 24,021 |
2021-09-30 | 52,385 | 15,192 | 9,807 |
NVS's Quality Factors
The “Quality” component of the POWR Ratings focuses on 31 different factors of a companies fundamentals and operational strength. Here are some key insights as we drill into the specifics of these quality attributes.- NVS has a Quality Grade of B, ranking ahead of 86.01% of graded US stocks.
- NVS's asset turnover comes in at 0.42 -- ranking 108th of 682 Pharmaceutical Products stocks.
- GHSI, KALA, and ADAP are the stocks whose asset turnover ratios are most correlated with NVS.
The table below shows NVS's key quality metrics over time.
Period | Asset Turnover | Gross Margin | ROIC |
---|---|---|---|
2021-09-30 | 0.420 | 0.693 | 0.212 |
2021-06-30 | 0.406 | 0.691 | 0.194 |
2021-03-31 | 0.393 | 0.691 | 0.176 |
2020-12-31 | 0.392 | 0.697 | 0.182 |
2020-09-30 | 0.401 | 0.700 | 0.174 |
2020-06-30 | 0.412 | 0.699 | 0.180 |
Novartis AG ADR (NVS) Company Bio
Novartis AG is a Swiss-American multinational pharmaceutical corporation based in Basel, Switzerland and Cambridge, Massachusetts, United States (global research). It is one of the largest pharmaceutical companies in the world. (Source:Wikipedia)
Latest NVS News From Around the Web
Below are the latest news stories about NOVARTIS AG that investors may wish to consider to help them evaluate NVS as an investment opportunity.
Why Is AVROBIO (AVRO) Stock Up 83% Today?AVROBIO (AVRO) stock is seeing massive gains on Monday as the company sells one of its gene therapies to Novartis (NVS). |
AbbVie (ABBV) Gets FDA Nod for Lymphoma Drug EpcoritamabThe FDA approves AbbVie's (ABBV) epcoritamab, to be marketed as Epkinly, for relapsed/refractory large B-cell lymphoma, a form of NHL. Epkinly is AbbVie's third blood cancer drug. |
Novartis (NVS) Up 10.8% YTD on Strong Q1, Pipeline ProgressNovartis (NVS) gains 10.6% year to date on strong first-quarter results and encouraging data on Kisqali from the NATALEE study. |
Novartis CEO: Some Cancer Drugs Dropped From Pipeline Because of Medicare Price NegotiationsMedicare’s new ability to negotiate some drug prices is a "super high concern," according to CEO Vas Narasimhan. |
Why Novartis (NVS) is a Top Dividend Stock for Your PortfolioDividends are one of the best benefits to being a shareholder, but finding a great dividend stock is no easy task. Does Novartis (NVS) have what it takes? Let's find out. |
NVS Price Returns
1-mo | -5.46% |
3-mo | 20.08% |
6-mo | 11.79% |
1-year | 14.10% |
3-year | 24.77% |
5-year | 67.62% |
YTD | 12.09% |
2022 | 6.47% |
2021 | -5.12% |
2020 | 2.08% |
2019 | 28.03% |
2018 | 5.95% |
NVS Dividends
Ex-Dividend Date | Type | Payout Amount | Change | ||||||
---|---|---|---|---|---|---|---|---|---|
Loading, please wait... |
Continue Researching NVS
Want to see what other sources are saying about Novartis Ag's financials and stock price? Try the links below:Novartis Ag (NVS) Stock Price | Nasdaq
Novartis Ag (NVS) Stock Quote, History and News - Yahoo Finance
Novartis Ag (NVS) Stock Price and Basic Information | MarketWatch
Loading social stream, please wait...