Northwest Bancshares, Inc. (NWBI): Price and Financial Metrics
NWBI Price/Volume Stats
Current price | $11.87 | 52-week high | $14.74 |
Prev. close | $11.78 | 52-week low | $9.80 |
Day low | $11.39 | Volume | 1,282,200 |
Day high | $11.90 | Avg. volume | 682,555 |
50-day MA | $10.76 | Dividend yield | 6.86% |
200-day MA | $11.28 | Market Cap | 1.51B |
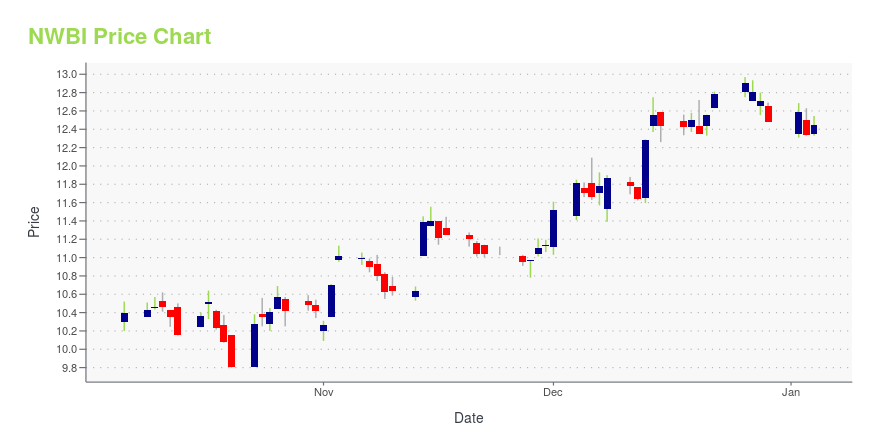
NWBI Stock Price Chart Interactive Chart >
NWBI POWR Grades
- NWBI scores best on the Stability dimension, with a Stability rank ahead of 65.62% of US stocks.
- The strongest trend for NWBI is in Stability, which has been heading up over the past 177 days.
- NWBI's current lowest rank is in the Quality metric (where it is better than 21.95% of US stocks).
NWBI Stock Summary
- Equity multiplier, or assets relative to shareholders' equity, comes in at 9.47 for NORTHWEST BANCSHARES INC; that's greater than it is for 88.67% of US stocks.
- With a year-over-year growth in debt of 107.21%, NORTHWEST BANCSHARES INC's debt growth rate surpasses 91.84% of about US stocks.
- NORTHWEST BANCSHARES INC's shareholder yield -- a measure of how much capital is returned to stockholders via dividends and buybacks -- is -24.11%, greater than the shareholder yield of merely 14.29% of stocks in our set.
- Stocks that are quantitatively similar to NWBI, based on their financial statements, market capitalization, and price volatility, are WSFS, FMAO, ABCB, BFIN, and LSBK.
- NWBI's SEC filings can be seen here. And to visit NORTHWEST BANCSHARES INC's official web site, go to www.northwest.bank.
NWBI Valuation Summary
- In comparison to the median Financial Services stock, NWBI's price/sales ratio is 13.04% higher, now standing at 2.6.
- Over the past 243 months, NWBI's EV/EBIT ratio has gone down 11.
Below are key valuation metrics over time for NWBI.
Stock | Date | P/S | P/B | P/E | EV/EBIT |
---|---|---|---|---|---|
NWBI | 2023-11-28 | 2.6 | 0.9 | 9.9 | 11.5 |
NWBI | 2023-11-27 | 2.6 | 0.9 | 9.9 | 11.5 |
NWBI | 2023-11-24 | 2.6 | 0.9 | 10.0 | 11.6 |
NWBI | 2023-11-22 | 2.6 | 0.9 | 10.0 | 11.5 |
NWBI | 2023-11-21 | 2.6 | 0.9 | 10.0 | 11.5 |
NWBI | 2023-11-20 | 2.7 | 1.0 | 10.1 | 11.7 |
NWBI Growth Metrics
- Its year over year revenue growth rate is now at 7.21%.
- Its 5 year revenue growth rate is now at 8.87%.
- Its 4 year net income to common stockholders growth rate is now at 88.81%.

The table below shows NWBI's growth in key financial areas (numbers in millions of US dollars).
Date | Revenue | Operating Cash Flow | Net Income to Common Stock |
---|---|---|---|
2022-09-30 | 503.398 | 177.991 | 129.073 |
2022-06-30 | 503.494 | 127.28 | 126.832 |
2022-03-31 | 525.847 | 114.982 | 142.373 |
2021-12-31 | 546.034 | 205.458 | 154.323 |
2021-09-30 | 557.668 | 124.172 | 159.332 |
2021-06-30 | 559.095 | 158.078 | 162.319 |
NWBI's Quality Factors
The “Quality” component of the POWR Ratings focuses on 31 different factors of a companies fundamentals and operational strength. Here are some key insights as we drill into the specifics of these quality attributes.- NWBI has a Quality Grade of C, ranking ahead of 43.22% of graded US stocks.
- NWBI's asset turnover comes in at 0.04 -- ranking 175th of 430 Banking stocks.
- STBA, SSB, and PPBI are the stocks whose asset turnover ratios are most correlated with NWBI.
The table below shows NWBI's key quality metrics over time.
Period | Asset Turnover | Gross Margin | ROIC |
---|---|---|---|
2021-06-30 | 0.040 | 1 | 0.016 |
2021-03-31 | 0.035 | 1 | 0.010 |
2020-12-31 | 0.034 | 1 | 0.007 |
2020-09-30 | 0.034 | 1 | 0.007 |
2020-06-30 | 0.034 | 1 | 0.007 |
2020-03-31 | 0.040 | 1 | 0.011 |
NWBI Price Target
For more insight on analysts targets of NWBI, see our NWBI price target page. And for a list of of all stocks sorted by upside potential based on analyst target price, see our Top Price Target page.
Average Price Target | $13.40 | Average Broker Recommendation | 2 (Hold) |
Northwest Bancshares, Inc. (NWBI) Company Bio
Northwest Bancshares operates as a bank holding company for Northwest Savings Bank that offers various personal and business banking solutions in the United States. The company operates through two segments, Community Banking and Consumer Finance. The company has branches across Pennsylvania, Western New York, Eastern Ohio, and Maryland. The company was founded in 1896 and is based in Warren, Pennsylvania.
Latest NWBI News From Around the Web
Below are the latest news stories about NORTHWEST BANCSHARES INC that investors may wish to consider to help them evaluate NWBI as an investment opportunity.
Can Northwest Bancshares (NWBI) Run Higher on Rising Earnings Estimates?Northwest Bancshares (NWBI) shares have started gaining and might continue moving higher in the near term, as indicated by solid earnings estimate revisions. |
12 Best Dividend Stocks Under $20In this article, we discuss 12 best dividend stocks under $20. You can skip our detailed analysis of dividend stocks and their performance in the past, and go directly to read 5 Best Dividend Stocks Under $20. In 2023, dividend-paying stocks faced difficulties, but experienced investors understand that short-term setbacks don’t deter them. They know […] |
Northwest Bancshares, Inc. (NASDAQ:NWBI) Will Pay A US$0.20 Dividend In Four DaysNorthwest Bancshares, Inc. ( NASDAQ:NWBI ) stock is about to trade ex-dividend in four days. The ex-dividend date is... |
Northwest Bancshares (NWBI) Reports Q3 Earnings: What Key Metrics Have to SayThe headline numbers for Northwest Bancshares (NWBI) give insight into how the company performed in the quarter ended September 2023, but it may be worthwhile to compare some of its key metrics to Wall Street estimates and the year-ago actuals. |
Northwest Bancshares (NWBI) Q3 Earnings and Revenues Top EstimatesNorthwest Bancshares (NWBI) delivered earnings and revenue surprises of 24% and 2.92%, respectively, for the quarter ended September 2023. Do the numbers hold clues to what lies ahead for the stock? |
NWBI Price Returns
1-mo | 11.67% |
3-mo | 13.42% |
6-mo | 7.46% |
1-year | -11.21% |
3-year | 13.93% |
5-year | -7.14% |
YTD | -9.05% |
2022 | 4.60% |
2021 | 17.77% |
2020 | -18.03% |
2019 | 2.36% |
2018 | 5.40% |
NWBI Dividends
Ex-Dividend Date | Type | Payout Amount | Change | ||||||
---|---|---|---|---|---|---|---|---|---|
Loading, please wait... |
Continue Researching NWBI
Here are a few links from around the web to help you further your research on Northwest Bancshares Inc's stock as an investment opportunity:Northwest Bancshares Inc (NWBI) Stock Price | Nasdaq
Northwest Bancshares Inc (NWBI) Stock Quote, History and News - Yahoo Finance
Northwest Bancshares Inc (NWBI) Stock Price and Basic Information | MarketWatch
Loading social stream, please wait...