
NorthWestern Corporation (NWE): Price and Financial Metrics
NWE Price/Volume Stats
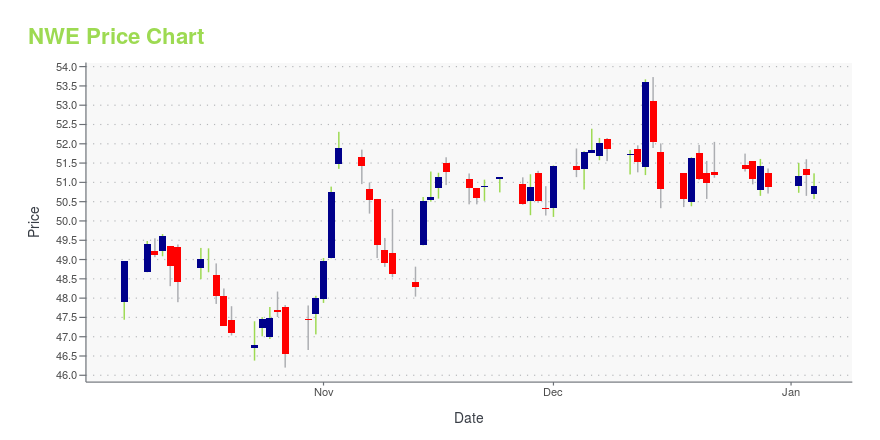
| Current price | $53.27 | 52-week high | $57.65 |
| Prev. close | $53.13 | 52-week low | $45.97 |
| Day low | $53.01 | Volume | 256,048 |
| Day high | $53.52 | Avg. volume | 331,943 |
| 50-day MA | $50.97 | Dividend yield | 4.99% |
| 200-day MA | $49.94 | Market Cap | 3.26B |
NWE Stock Price Chart Interactive Chart >
NorthWestern Corporation (NWE) Company Bio
Northwestern Corporation provides electricity and natural gas to residential, commercial, and industrial customers in Montana, South Dakota, and Nebraska. The company was founded in 1923 and is based in Sioux Falls, South Dakota.
Latest NWE News From Around the Web
Below are the latest news stories about NORTHWESTERN CORP that investors may wish to consider to help them evaluate NWE as an investment opportunity.
Dividend Achievers List Ranked By Yield: Top 30In this article, we discuss top 30 dividend achievers according to dividend yield. You can skip our detailed analysis of dividend growers and their performance over the years, and go directly to read Dividend Achievers List Ranked By Yield: Top 10. Dividend Achievers are a group of companies known for consistently increasing their dividends for […] |
The NorthWestern Energy Group Inc (NWE) Company: A Short SWOT AnalysisUnveiling the Strengths, Weaknesses, Opportunities, and Threats of NorthWestern Energy Group Inc (NWE) |
NorthWestern Corporation (NASDAQ:NWE) Q3 2023 Earnings Call TranscriptNorthWestern Corporation (NASDAQ:NWE) Q3 2023 Earnings Call Transcript October 27, 2023 Travis Meyer: Good afternoon, and thank you for joining NorthWestern Energy Group’s Financial Results Webcast for the quarter ended September 30, 2023. My name is Travis Meyer. I’m the Director of Corporate Development and Investor Relations Officer for NorthWestern. Joining us today to walk […] |
Q3 2023 NorthWestern Corp Earnings CallQ3 2023 NorthWestern Corp Earnings Call |
NorthWestern Reports Third Quarter 2023 Financial ResultsCompany reports GAAP diluted earnings per share of $0.48 for the quarter; affirms $510 million capital plan for 2023; initiates earnings guidance for 2023 and 2024 and increases long-term earnings per share growth to 4% to 6% from a 2022 adjusted base year; and announces a $0.64 per share quarterly dividend payable December 29, 2023 BUTTE, Mont. and SIOUX FALLS, S.D., Oct. 26, 2023 (GLOBE NEWSWIRE) -- NorthWestern Energy Group, Inc. d/b/a NorthWestern Energy (Nasdaq: NWE) reported financial resu |
NWE Price Returns
| 1-mo | 8.18% |
| 3-mo | 8.91% |
| 6-mo | 14.42% |
| 1-year | -1.64% |
| 3-year | -2.47% |
| 5-year | -7.12% |
| YTD | 7.45% |
| 2023 | -10.12% |
| 2022 | 8.49% |
| 2021 | 2.10% |
| 2020 | -15.15% |
| 2019 | 24.50% |
NWE Dividends
| Ex-Dividend Date | Type | Payout Amount | Change | ||||||
|---|---|---|---|---|---|---|---|---|---|
| Loading, please wait... | |||||||||
Continue Researching NWE
Want to do more research on Northwestern Corp's stock and its price? Try the links below:Northwestern Corp (NWE) Stock Price | Nasdaq
Northwestern Corp (NWE) Stock Quote, History and News - Yahoo Finance
Northwestern Corp (NWE) Stock Price and Basic Information | MarketWatch
Loading social stream, please wait...