
Newell Brands Inc. (NWL): Price and Financial Metrics
NWL Price/Volume Stats
| Current price | $8.91 | 52-week high | $11.61 |
| Prev. close | $6.34 | 52-week low | $5.39 |
| Day low | $7.14 | Volume | 26,323,500 |
| Day high | $8.96 | Avg. volume | 4,880,400 |
| 50-day MA | $6.99 | Dividend yield | 4.44% |
| 200-day MA | $7.55 | Market Cap | 3.70B |
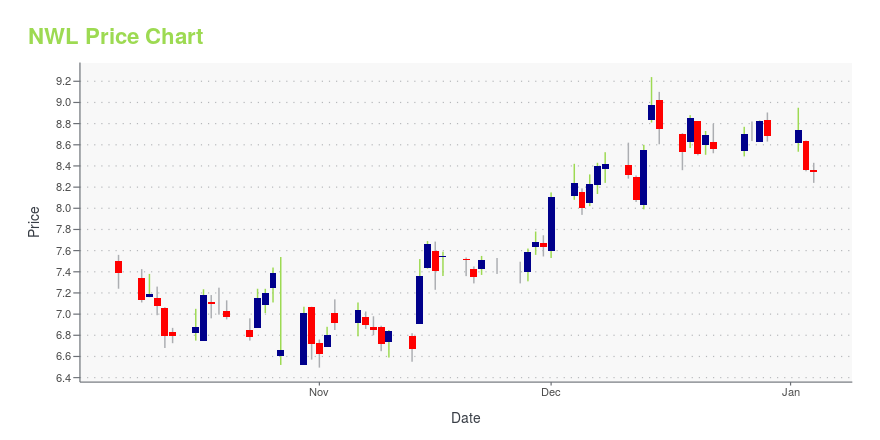
NWL Stock Price Chart Interactive Chart >
Newell Brands Inc. (NWL) Company Bio
Newell Brands is an American manufacturer, marketer and distributor of consumer and commercial products. The company's brands and products include Rubbermaid storage and trash containers; home organization and reusable container products; Contigo and Bubba water bottles; Coleman outdoor products; writing instruments (Berol, Expo Markers, PaperMate, Dymo, Mr. Sketch, Parker Pens, Sharpie, Reynolds, Prismacolor, Rotring, X-acto, Waterman) glue (Elmer's, Krazy Glue); children's products (Aprica, NUK, Tigex, Babysun, Baby Jogger and Graco); First Alert alarm systems, cookware and small kitchen appliances (Calphalon, Sunbeam, Rival, Crock-Pot; Holmes, FoodSaver, Oster, Osterizer, and Mr. Coffee) and fragrance products (Yankee Candle, Chesapeake Bay Candle, Millefiori Milano, and WoodWick. (Source:Wikipedia)
Latest NWL News From Around the Web
Below are the latest news stories about NEWELL BRANDS INC that investors may wish to consider to help them evaluate NWL as an investment opportunity.
Self-Driving Vehicles Are Finding a Home in Industrial OperationsRobotic trucks may face an uphill climb on public roads, but automation is claiming a place in freight yards and warehouses. |
2 Stocks to Sell by Dec. 31 (and 2 to Buy ASAP!)As 2023 wraps up, these two stocks to sell look poised to decline in 2024. |
13 Best Low-Priced Dividend Stocks To Invest InIn this article, we will take a detailed look at the 13 Best Low-Priced Dividend Stocks To Invest In. For a quick overview of such stocks, read our article 5 Best Low-Priced Dividend Stocks To Invest In. Stocks rebounded sharply in 2023 despite recession clouds and macro uncertainty. This development did not bode well for dividend investors who were bracing […] |
Newell (NWL) Keen on Restructuring & Cost Savings: Stock to GainNewell (NWL) looks poised for long-term growth on its recently announced restructuring and cost-saving plans. Near-term headwinds related to tough macro conditions and inflation are concerning. |
Australia's NAB, Jarden Wealth combine NZ wealth & asset management unitsThe new entity, to be called FirstCape, would also hold NZ$15 billion of funds under management, NAB said on Thursday. The combination would bring together NAB's JBWere New Zealand and BNZ Investment Services business with Jarden's Wealth Solutions and Harbour Asset Management to create an advice and asset management business for clients in New Zealand, NAB said. |
NWL Price Returns
| 1-mo | 39.66% |
| 3-mo | 15.46% |
| 6-mo | 4.50% |
| 1-year | -9.98% |
| 3-year | -62.92% |
| 5-year | -21.20% |
| YTD | 4.62% |
| 2023 | -30.93% |
| 2022 | -37.02% |
| 2021 | 6.75% |
| 2020 | 16.73% |
| 2019 | 9.43% |
NWL Dividends
| Ex-Dividend Date | Type | Payout Amount | Change | ||||||
|---|---|---|---|---|---|---|---|---|---|
| Loading, please wait... | |||||||||
Continue Researching NWL
Here are a few links from around the web to help you further your research on Newell Brands Inc's stock as an investment opportunity:Newell Brands Inc (NWL) Stock Price | Nasdaq
Newell Brands Inc (NWL) Stock Quote, History and News - Yahoo Finance
Newell Brands Inc (NWL) Stock Price and Basic Information | MarketWatch
Loading social stream, please wait...