Quanex Building Products Corporation (NX): Price and Financial Metrics
GET POWR RATINGS... FREE!
NX POWR Grades
- NX scores best on the Value dimension, with a Value rank ahead of 88.64% of US stocks.
- The strongest trend for NX is in Stability, which has been heading up over the past 179 days.
- NX's current lowest rank is in the Growth metric (where it is better than 51.66% of US stocks).
NX Stock Summary
- NX's went public 34.27 years ago, making it older than 89.7% of listed US stocks we're tracking.
- NX's price/sales ratio is 0.67; that's higher than the P/S ratio of merely 16.12% of US stocks.
- In terms of volatility of its share price, NX is more volatile than only 11.74% of stocks we're observing.
- Stocks that are quantitatively similar to NX, based on their financial statements, market capitalization, and price volatility, are PFC, GABC, WERN, SPFI, and RVSB.
- Visit NX's SEC page to see the company's official filings. To visit the company's web site, go to www.quanex.com.
NX Valuation Summary
- NX's price/sales ratio is 0.7; this is 69.57% lower than that of the median Basic Materials stock.
- NX's EV/EBIT ratio has moved down 76.1 over the prior 243 months.
- Over the past 243 months, NX's price/sales ratio has gone up 0.3.
Below are key valuation metrics over time for NX.
Stock | Date | P/S | P/B | P/E | EV/EBIT |
---|---|---|---|---|---|
NX | 2021-09-03 | 0.7 | 1.8 | 12.7 | 9.9 |
NX | 2021-09-02 | 0.8 | 2.0 | 14.5 | 11.5 |
NX | 2021-09-01 | 0.8 | 2.0 | 14.3 | 11.4 |
NX | 2021-08-31 | 0.8 | 2.0 | 14.3 | 11.4 |
NX | 2021-08-30 | 0.8 | 2.0 | 14.3 | 11.4 |
NX | 2021-08-27 | 0.8 | 2.0 | 14.5 | 11.5 |
NX Growth Metrics
- Its year over year revenue growth rate is now at 12.18%.
- The 2 year price growth rate now stands at -24.64%.
- Its 4 year cash and equivalents growth rate is now at 176.72%.

The table below shows NX's growth in key financial areas (numbers in millions of US dollars).
Date | Revenue | Operating Cash Flow | Net Income to Common Stock |
---|---|---|---|
2021-12-31 | 1,109.042 | 60.332 | 60.367 |
2021-09-30 | 1,072.149 | 78.588 | 56.98 |
2021-06-30 | 1,035.786 | 100.67 | 58.234 |
2021-03-31 | 968.005 | 127.284 | 55.388 |
2020-12-31 | 885.123 | 101.058 | 46.338 |
2020-09-30 | 851.573 | 100.796 | 38.496 |
NX's Quality Factors
The “Quality” component of the POWR Ratings focuses on 31 different factors of a companies fundamentals and operational strength. Here are some key insights as we drill into the specifics of these quality attributes.- NX has a Quality Grade of B, ranking ahead of 76.25% of graded US stocks.
- NX's asset turnover comes in at 1.469 -- ranking 8th of 41 Steel Works Etc stocks.
- UAMY, SXC, and NANX are the stocks whose asset turnover ratios are most correlated with NX.
The table below shows NX's key quality metrics over time.
Period | Asset Turnover | Gross Margin | ROIC |
---|---|---|---|
2021-07-31 | 1.469 | 0.234 | 0.189 |
2021-04-30 | 1.389 | 0.239 | 0.170 |
2021-01-31 | 1.271 | 0.234 | 0.132 |
2020-10-31 | 1.235 | 0.226 | 0.109 |
2020-07-31 | 1.234 | 0.220 | 0.007 |
2020-04-30 | 1.276 | 0.222 | 0.013 |
NX Price Target
For more insight on analysts targets of NX, see our NX price target page. And for a list of of all stocks sorted by upside potential based on analyst target price, see our Top Price Target page.
Average Price Target | $33.00 | Average Broker Recommendation | 1.5 (Moderate Buy) |
NX Stock Price Chart Interactive Chart >
NX Price/Volume Stats
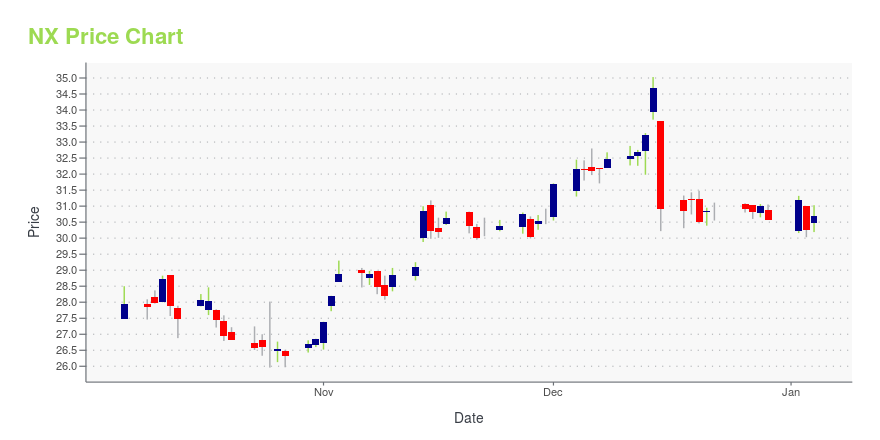
Current price | $19.98 | 52-week high | $28.30 |
Prev. close | $19.64 | 52-week low | $18.87 |
Day low | $19.61 | Volume | 75,014 |
Day high | $20.12 | Avg. volume | 141,975 |
50-day MA | $20.56 | Dividend yield | 1.63% |
200-day MA | $22.08 | Market Cap | 667.11M |
Quanex Building Products Corporation (NX) Company Bio
Quanex Building Products is a manufacturer of engineered materials and components for building products sold to Original Equipment Manufacturers (OEMs). Quanex designs and produces energy-efficient window and door products, systems and solutions. The company was founded in 1927 and is based in Houston, Texas.
Latest NX News From Around the Web
Below are the latest news stories about Quanex Building Products CORP that investors may wish to consider to help them evaluate NX as an investment opportunity.
Installed Building Products (IBP) Misses Q4 Earnings EstimatesInstalled Building Products (IBP) delivered earnings and revenue surprises of -7.19% and 1.90%, respectively, for the quarter ended December 2021. Do the numbers hold clues to what lies ahead for the stock? |
Quanex Building Products Announces Results of Annual Meeting and Declares Quarterly DividendHOUSTON, TEXAS, Feb. 23, 2022 (GLOBE NEWSWIRE) -- Quanex Building Products Corporation (NYSE: NX) (“Quanex” or the “Company”) today announced the results from its Annual Meeting of Stockholders held on February 22, 2022. In addition, Quanex announced that its Board of Directors (the “Board”) declared a quarterly cash dividend of $0.08 per share on the Company’s common stock, payable March 30, 2022, to shareholders of record on March 15, 2022. The stockholders approved each of the following propo |
TopBuild (BLD) Q4 Earnings and Revenues Surpass EstimatesTopBuild (BLD) delivered earnings and revenue surprises of 4.35% and 3.57%, respectively, for the quarter ended December 2021. Do the numbers hold clues to what lies ahead for the stock? |
Quanex Building Products Announces First Quarter 2022 Earnings Release and Conference Call ScheduleHOUSTON, TEXAS, Feb. 17, 2022 (GLOBE NEWSWIRE) -- Quanex Building Products Corporation (NYSE: NX) (“Quanex” or the “Company”) today announced plans to release its first quarter 2022 results on Thursday, March 3, 2022 after trading closes on the New York Stock Exchange. The Company has also scheduled a conference call for Friday, March 4, 2022 at 11:00 a.m. ET (10:00 a.m. CT) to discuss the release. Investors may participate in the conference call via telephone by dialing (877) 388-2139 for domes |
PGT (PGTI) Tops Q4 Earnings and Revenue EstimatesPGT (PGTI) delivered earnings and revenue surprises of 3.33% and 1.71%, respectively, for the quarter ended December 2021. Do the numbers hold clues to what lies ahead for the stock? |
NX Price Returns
1-mo | 2.04% |
3-mo | -12.52% |
6-mo | -8.92% |
1-year | -23.57% |
3-year | 29.31% |
5-year | 10.78% |
YTD | -19.09% |
2021 | 13.25% |
2020 | 32.53% |
2019 | 27.99% |
2018 | -41.08% |
2017 | 16.15% |
NX Dividends
Ex-Dividend Date | Type | Payout Amount | Change | ||||||
---|---|---|---|---|---|---|---|---|---|
Loading, please wait... |
Continue Researching NX
Want to see what other sources are saying about Quanex Building Products CORP's financials and stock price? Try the links below:Quanex Building Products CORP (NX) Stock Price | Nasdaq
Quanex Building Products CORP (NX) Stock Quote, History and News - Yahoo Finance
Quanex Building Products CORP (NX) Stock Price and Basic Information | MarketWatch
Loading social stream, please wait...