
New York Times Company (The) (NYT): Price and Financial Metrics
NYT Price/Volume Stats
| Current price | $53.87 | 52-week high | $55.63 |
| Prev. close | $53.39 | 52-week low | $39.73 |
| Day low | $53.00 | Volume | 755,889 |
| Day high | $54.32 | Avg. volume | 1,204,222 |
| 50-day MA | $51.20 | Dividend yield | 0.94% |
| 200-day MA | $46.39 | Market Cap | 8.85B |
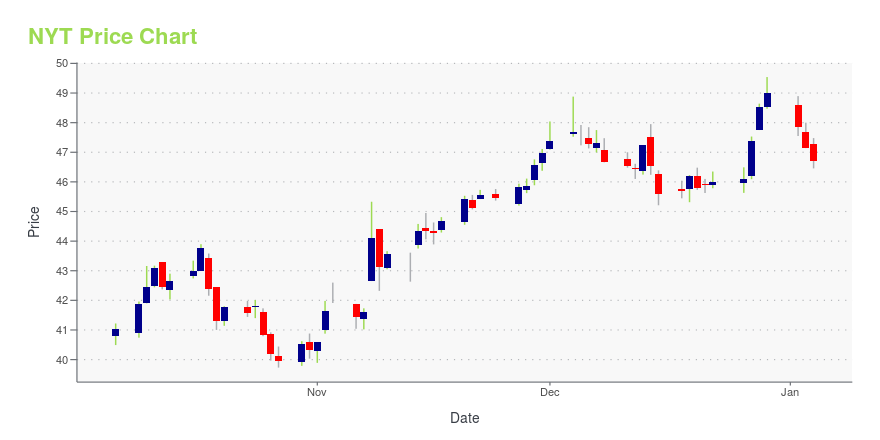
NYT Stock Price Chart Interactive Chart >
New York Times Company (The) (NYT) Company Bio
New York Times owns newspapers, digital businesses and has investments in paper mills. The company was founded in 1896 and is based in New York, New York.
Latest NYT News From Around the Web
Below are the latest news stories about NEW YORK TIMES CO that investors may wish to consider to help them evaluate NYT as an investment opportunity.
How the NYT and other publications could scale the AI trendThe New York Times (NYT) shares are trending higher after opening a copyright infringement lawsuit against Microsoft (MSFT) and OpenAI for using its articles to train its artificial intelligence models. Evercore ISI predicts that this case will lead to AI licensing deals for the newspaper with “each worth low tens of millions of dollars of revenue per year that largely flows through to AOP [Annual Operating Plan]." Yahoo Finance’s Brian Sozzi and Brad Smith weigh in on potential revenue the New York Times and other publications could stand to gain in the case that said licensing deals take place. For more expert insight and the latest market action, click here to watch this full episode of Yahoo Finance Live. |
Company News for Dec 28, 2023Companies In The Article Are:CYTK,TSLA, NYT, MSFT, IOVA |
The New York Times Company (NYSE:NYT) Looks Like A Good Stock, And It's Going Ex-Dividend SoonIt looks like The New York Times Company ( NYSE:NYT ) is about to go ex-dividend in the next 4 days. The ex-dividend... |
NYT vs. Microsoft: AI copyright suit will be 'complex'The New York Times (NYT) is suing OpenAI and Microsoft (MSFT) for allegedly using millions of articles without permission to train its AI chatbots. MIT Initiative on the Digital Economy Director Sinan Aral and Newsroom Robots Podcast host Nikita Roy discuss the details of the copyright lawsuit and potential implications for the publishing industry with Yahoo Finance Live. Roy says she was "completely expecting" this scenario, suggesting the Times is "helping" smaller publishers lacking resources to take legal action. However, she notes accusing chatbots of infringement is "complex," hinging on whether courts deem AI a tool or if liability falls on the user. Still, Roy stresses that "we are facing a very ethical issue" regarding how creators' work gets utilized. "This is a debate about w... |
New York Times Sues Microsoft and OpenAI for Copyright Infringement(Bloomberg) -- The New York Times Co. sued Microsoft Corp. and OpenAI Inc. for using its content to help develop artificial intelligence services, in a sign of the increasingly fraught relationship between the media and a technology that could upend the news industry.Most Read from BloombergThe Late-Night Email to Tim Cook That Set the Apple Watch Saga in MotionChinese Carmaker Overtakes Tesla as World’s Most Popular EV MakerBridgewater CEO’s Past Office Romance Led to Favoritism ClaimsL’Oreal H |
NYT Price Returns
| 1-mo | 7.05% |
| 3-mo | 25.10% |
| 6-mo | 10.12% |
| 1-year | 36.36% |
| 3-year | 26.83% |
| 5-year | 58.40% |
| YTD | 10.82% |
| 2023 | 52.60% |
| 2022 | -32.16% |
| 2021 | -6.18% |
| 2020 | 61.92% |
| 2019 | 45.26% |
NYT Dividends
| Ex-Dividend Date | Type | Payout Amount | Change | ||||||
|---|---|---|---|---|---|---|---|---|---|
| Loading, please wait... | |||||||||
Continue Researching NYT
Want to do more research on New York Times Co's stock and its price? Try the links below:New York Times Co (NYT) Stock Price | Nasdaq
New York Times Co (NYT) Stock Quote, History and News - Yahoo Finance
New York Times Co (NYT) Stock Price and Basic Information | MarketWatch
Loading social stream, please wait...