Realty Income Corp. (O): Price and Financial Metrics
O Price/Volume Stats
Current price | $54.60 | 52-week high | $68.85 |
Prev. close | $53.96 | 52-week low | $45.03 |
Day low | $53.75 | Volume | 6,197,000 |
Day high | $54.75 | Avg. volume | 4,719,819 |
50-day MA | $50.78 | Dividend yield | 5.71% |
200-day MA | $58.01 | Market Cap | 39.53B |
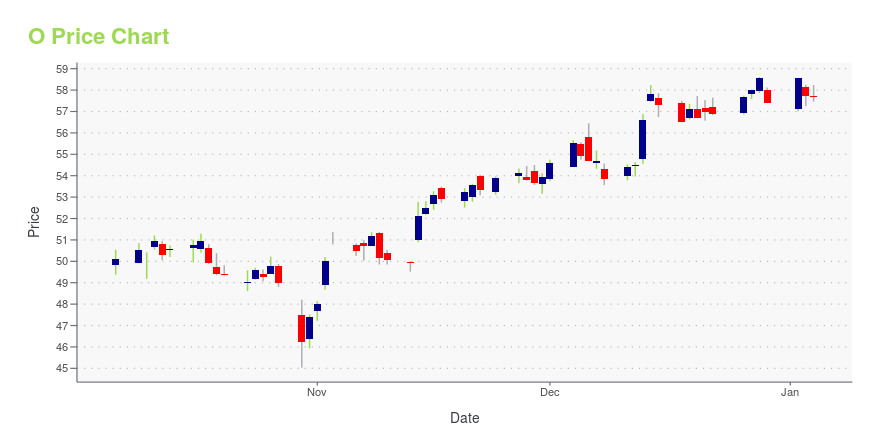
O Stock Price Chart Interactive Chart >
O POWR Grades
- Momentum is the dimension where O ranks best; there it ranks ahead of 59.37% of US stocks.
- O's strongest trending metric is Growth; it's been moving up over the last 177 days.
- O's current lowest rank is in the Value metric (where it is better than 6.06% of US stocks).
O Stock Summary
- O has a market capitalization of $36,239,617,619 -- more than approximately 93.66% of US stocks.
- Of note is the ratio of REALTY INCOME CORP's sales and general administrative expense to its total operating expenses; just 2.53% of US stocks have a lower such ratio.
- The ratio of debt to operating expenses for REALTY INCOME CORP is higher than it is for about 91.81% of US stocks.
- If you're looking for stocks that are quantitatively similar to REALTY INCOME CORP, a group of peers worth examining would be AVB, PSA, EQR, ET, and SRE.
- Visit O's SEC page to see the company's official filings. To visit the company's web site, go to www.realtyincome.com.
O Valuation Summary
- O's price/sales ratio is 9.4; this is 123.81% higher than that of the median Real Estate stock.
- O's price/sales ratio has moved down 1 over the prior 243 months.
Below are key valuation metrics over time for O.
Stock | Date | P/S | P/B | P/E | EV/EBIT |
---|---|---|---|---|---|
O | 2023-11-07 | 9.4 | 1.2 | 41.7 | 36.0 |
O | 2023-11-06 | 9.7 | 1.1 | 41.2 | 36.8 |
O | 2023-11-03 | 9.8 | 1.2 | 41.6 | 37.0 |
O | 2023-11-02 | 9.6 | 1.1 | 40.9 | 36.6 |
O | 2023-11-01 | 9.2 | 1.1 | 39.2 | 35.6 |
O | 2023-10-31 | 9.1 | 1.1 | 38.7 | 35.3 |
O Growth Metrics
- Its 2 year net income to common stockholders growth rate is now at -2.01%.
- The 5 year price growth rate now stands at -12.09%.
- The 4 year price growth rate now stands at -12.09%.

The table below shows O's growth in key financial areas (numbers in millions of US dollars).
Date | Revenue | Operating Cash Flow | Net Income to Common Stock |
---|---|---|---|
2022-12-31 | 3,343.681 | 2,563.856 | 869.408 |
2022-09-30 | 3,136.533 | 2,285.489 | 646.184 |
2022-06-30 | 2,791.139 | 1,997.616 | 561.613 |
2022-03-31 | 2,445.002 | 1,569.215 | 462.885 |
2021-12-31 | 2,080.463 | 1,322.189 | 359.456 |
2021-09-30 | 1,817.037 | 1,275.804 | 473.346 |
O's Quality Factors
The “Quality” component of the POWR Ratings focuses on 31 different factors of a companies fundamentals and operational strength. Here are some key insights as we drill into the specifics of these quality attributes.- O has a Quality Grade of C, ranking ahead of 31.8% of graded US stocks.
- O's asset turnover comes in at 0.083 -- ranking 255th of 444 Trading stocks.
- OUT, AAT, and GBCS are the stocks whose asset turnover ratios are most correlated with O.
The table below shows O's key quality metrics over time.
Period | Asset Turnover | Gross Margin | ROIC |
---|---|---|---|
2021-09-30 | 0.083 | 0.936 | 0.028 |
2021-06-30 | 0.083 | 0.935 | 0.025 |
2021-03-31 | 0.083 | 0.936 | 0.025 |
2020-12-31 | 0.084 | 0.937 | 0.028 |
2020-09-30 | 0.086 | 0.937 | 0.029 |
2020-06-30 | 0.087 | 0.939 | 0.033 |
O Price Target
For more insight on analysts targets of O, see our O price target page. And for a list of of all stocks sorted by upside potential based on analyst target price, see our Top Price Target page.
Average Price Target | $78.31 | Average Broker Recommendation | 1.61 (Moderate Buy) |
Realty Income Corp. (O) Company Bio
Realty Income Corporation is a real estate investment trust that invests in free-standing, single-tenant commercial properties in the United States, Spain and the United Kingdom that are subject to NNN Leases. The company is organized in Maryland with its headquarters in San Diego, California. (Source:Wikipedia)
Latest O News From Around the Web
Below are the latest news stories about REALTY INCOME CORP that investors may wish to consider to help them evaluate O as an investment opportunity.
Should Investors Retain Realty Income (O) Stock for Now?A diversified tenant base, accretive buyouts and solid balance sheet strength bode well for Realty Income (O). However, higher e-commerce adoption and high interest rates are key concerns. |
Worried About Market Volatility? Invest In These High-Yield Dividend Stocks For Consistent Passive IncomeWhile the stock market has been recovering since the pullback last year, market volatility remains high as geopolitical tensions persist. The recent crisis in the Middle East has sparked concerns regarding broader regional instability. The weakening economy has caused investors to cause the November rally to halt, with the Dow Jones Industrial Average index declining marginally intraday on Tuesday. The National Retail Federation expects retail sales to grow at the slowest pace in the last five y |
These 3 No-Brainer Buy and Hold Forever Stocks Are Bargains TodayRealty Income (NYSE: O), Equity Commonwealth (NYSE: EQC), and Brookfield Corporation (NYSE: BN) stand out to a few Fool.com contributors because they trade at such attractive valuations. Jason Hall (Realty Income): It's a tough time if you're a capital-intensive business and you don't already have a lot of capital. This is especially true in real estate, where debt financing and stock offerings are your main ways of raising money. |
2 Bargain Basement Stocks to Buy on the DipThese REITs are out of favor, but they offer attractive yields backed by industry-leading companies. |
1 Dividend Stock You'll Regret Not Buying NowWhile financial journals all over the world can't seem to write enough about artificial intelligence (AI), it's important to remember that there are many ways to capitalize on markets. One of the best ways to build wealth is by investing in dividend stocks. As I've written previously, one of the best and safest ways to invest in dividend stocks is to look at business development companies (BDCs) or real estate investment trusts (REIT). |
O Price Returns
1-mo | 9.66% |
3-mo | -1.33% |
6-mo | -6.36% |
1-year | -8.52% |
3-year | 3.23% |
5-year | 5.80% |
YTD | -9.64% |
2022 | -7.37% |
2021 | 20.11% |
2020 | -11.59% |
2019 | 21.27% |
2018 | 15.95% |
O Dividends
Ex-Dividend Date | Type | Payout Amount | Change | ||||||
---|---|---|---|---|---|---|---|---|---|
Loading, please wait... |
Continue Researching O
Want to do more research on Realty Income Corp's stock and its price? Try the links below:Realty Income Corp (O) Stock Price | Nasdaq
Realty Income Corp (O) Stock Quote, History and News - Yahoo Finance
Realty Income Corp (O) Stock Price and Basic Information | MarketWatch
Loading social stream, please wait...