
OFS Capital Corporation (OFS): Price and Financial Metrics
OFS Price/Volume Stats
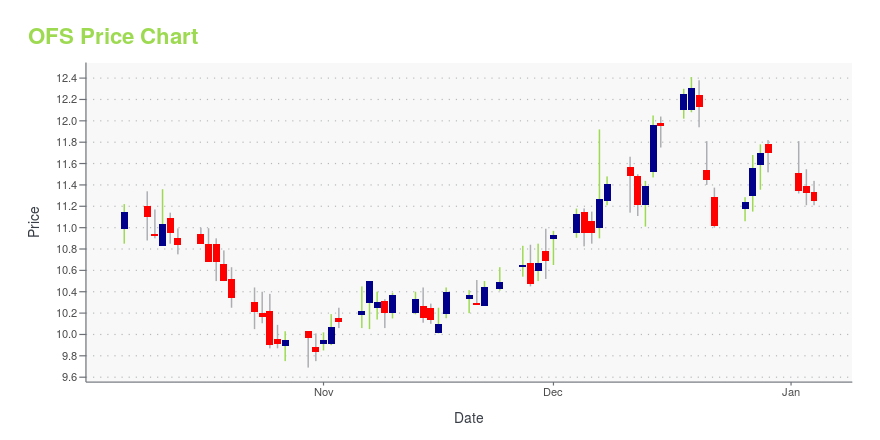
| Current price | $8.64 | 52-week high | $12.44 |
| Prev. close | $8.54 | 52-week low | $8.42 |
| Day low | $8.50 | Volume | 57,770 |
| Day high | $8.64 | Avg. volume | 45,909 |
| 50-day MA | $9.28 | Dividend yield | 15.56% |
| 200-day MA | $10.32 | Market Cap | 115.76M |
OFS Stock Price Chart Interactive Chart >
OFS Capital Corporation (OFS) Company Bio
OFS Capital Corporation is a business development company specializing in direct and fund investments as well as add-on acquisitions. It does not invest in operational turnarounds or start-up businesses. The company is based in Chicago, Illinois.
Latest OFS News From Around the Web
Below are the latest news stories about OFS CAPITAL CORP that investors may wish to consider to help them evaluate OFS as an investment opportunity.
Is OFS Capital (OFS) a Great Stock for Value Investors?Is OFS Capital (OFS) a great pick from the value investor's perspective right now? Read on to know more. |
OFS Capital Corporation (NASDAQ:OFS) Q3 2023 Earnings Call TranscriptOFS Capital Corporation (NASDAQ:OFS) Q3 2023 Earnings Call Transcript November 3, 2023 Operator: Good morning, and welcome to the OFS Capital Corporation Third Quarter 2023 Earnings Conference Call. [Operator Instructions] Please note, this event is being recorded. I would now like to turn the conference over to Steve Altebrando, Vice President of Capital Markets. Please […] |
OFS Capital Corp (OFS) Reports Q3 2023 Earnings, Net Investment Income Rises to $0.40 Per ShareNet Asset Value Per Share Stands at $12.74, Investment Portfolio's Weighted-Average Performing Income Yield Increases to 14.6% |
OFS Capital Corporation Announces Third Quarter 2023 Financial ResultsCHICAGO, November 02, 2023--OFS Capital Corporation (NASDAQ: OFS) ("OFS Capital," the "Company," "we," "us," or "our") today announced its financial results for the fiscal quarter ended September 30, 2023. |
OFS Capital Corporation Announces Date for Its Third Quarter 2023 Earnings Release and Conference CallCHICAGO, October 25, 2023--OFS Capital Corporation (NASDAQ: OFS) ("OFS Capital"), a business development company, announced today that it will report its third quarter 2023 earnings results after the closing of the stock market on Thursday, November 2, 2023. |
OFS Price Returns
| 1-mo | -2.37% |
| 3-mo | -5.35% |
| 6-mo | -21.41% |
| 1-year | -6.70% |
| 3-year | 29.36% |
| 5-year | 40.86% |
| YTD | -20.94% |
| 2023 | 29.93% |
| 2022 | 3.28% |
| 2021 | 66.92% |
| 2020 | -25.16% |
| 2019 | 17.95% |
OFS Dividends
| Ex-Dividend Date | Type | Payout Amount | Change | ||||||
|---|---|---|---|---|---|---|---|---|---|
| Loading, please wait... | |||||||||
Continue Researching OFS
Want to do more research on OFS Capital Corp's stock and its price? Try the links below:OFS Capital Corp (OFS) Stock Price | Nasdaq
OFS Capital Corp (OFS) Stock Quote, History and News - Yahoo Finance
OFS Capital Corp (OFS) Stock Price and Basic Information | MarketWatch
Loading social stream, please wait...