OGE Energy Corp (OGE): Price and Financial Metrics
OGE Price/Volume Stats
Current price | $35.74 | 52-week high | $42.91 |
Prev. close | $35.01 | 52-week low | $33.28 |
Day low | $34.85 | Volume | 338,120 |
Day high | $35.74 | Avg. volume | 1,101,366 |
50-day MA | $37.01 | Dividend yield | 4.73% |
200-day MA | $38.12 | Market Cap | 7.16B |
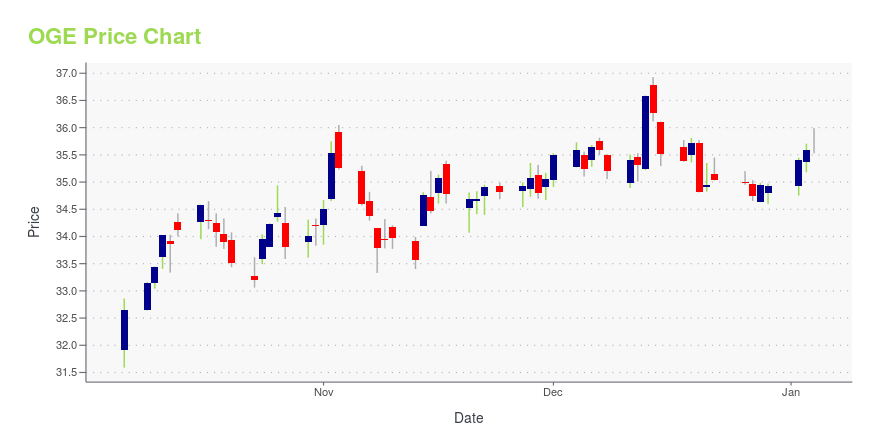
OGE Stock Price Chart Interactive Chart >
OGE POWR Grades
- OGE scores best on the Momentum dimension, with a Momentum rank ahead of 70.99% of US stocks.
- OGE's strongest trending metric is Quality; it's been moving down over the last 179 days.
- OGE ranks lowest in Sentiment; there it ranks in the 34th percentile.
OGE Stock Summary
- OGE's went public 35.42 years ago, making it older than 90.88% of listed US stocks we're tracking.
- Of note is the ratio of OGE ENERGY CORP's sales and general administrative expense to its total operating expenses; just 0.35% of US stocks have a lower such ratio.
- In terms of volatility of its share price, OGE is more volatile than merely 4.09% of stocks we're observing.
- Stocks that are quantitatively similar to OGE, based on their financial statements, market capitalization, and price volatility, are MDU, CPT, SBRA, SB, and PAC.
- OGE's SEC filings can be seen here. And to visit OGE ENERGY CORP's official web site, go to www.ogeenergy.com.
OGE Valuation Summary
- In comparison to the median Utilities stock, OGE's price/sales ratio is 4.35% lower, now standing at 2.2.
- Over the past 243 months, OGE's price/earnings ratio has gone down 0.2.
Below are key valuation metrics over time for OGE.
Stock | Date | P/S | P/B | P/E | EV/EBIT |
---|---|---|---|---|---|
OGE | 2023-05-17 | 2.2 | 1.7 | 17.2 | 17.8 |
OGE | 2023-05-16 | 2.2 | 1.7 | 17.3 | 17.8 |
OGE | 2023-05-15 | 2.2 | 1.7 | 17.6 | 18.0 |
OGE | 2023-05-12 | 2.3 | 1.7 | 17.8 | 18.2 |
OGE | 2023-05-11 | 2.2 | 1.7 | 17.7 | 18.1 |
OGE | 2023-05-10 | 2.3 | 1.7 | 17.9 | 18.2 |
OGE Growth Metrics
- Its 5 year net income to common stockholders growth rate is now at -130.17%.
- Its year over year price growth rate is now at 15.64%.
- Its 2 year net cashflow from operations growth rate is now at -9.35%.

The table below shows OGE's growth in key financial areas (numbers in millions of US dollars).
Date | Revenue | Operating Cash Flow | Net Income to Common Stock |
---|---|---|---|
2022-12-31 | 3,375.7 | 843.1 | 665.7 |
2022-09-30 | 3,245.1 | 948.6 | 934.6 |
2022-06-30 | 2,838.7 | 462.6 | 924.3 |
2022-03-31 | 2,612.4 | 685.8 | 964.1 |
2021-12-31 | 3,653.7 | -313.3 | 737.3 |
2021-09-30 | 3,557.8 | -306.6 | 472.9 |
OGE's Quality Factors
The “Quality” component of the POWR Ratings focuses on 31 different factors of a companies fundamentals and operational strength. Here are some key insights as we drill into the specifics of these quality attributes.- OGE has a Quality Grade of C, ranking ahead of 60.01% of graded US stocks.
- OGE's asset turnover comes in at 0.302 -- ranking 25th of 105 Utilities stocks.
- KMI, WMB, and BEP are the stocks whose asset turnover ratios are most correlated with OGE.
The table below shows OGE's key quality metrics over time.
Period | Asset Turnover | Gross Margin | ROIC |
---|---|---|---|
2021-06-30 | 0.302 | 0.435 | 0.046 |
2021-03-31 | 0.306 | 0.441 | 0.047 |
2020-12-31 | 0.202 | 0.696 | -0.011 |
2020-09-30 | 0.199 | 0.695 | -0.014 |
2020-06-30 | 0.202 | 0.691 | -0.011 |
2020-03-31 | 0.200 | 0.674 | -0.011 |
OGE Price Target
For more insight on analysts targets of OGE, see our OGE price target page. And for a list of of all stocks sorted by upside potential based on analyst target price, see our Top Price Target page.
Average Price Target | $37.89 | Average Broker Recommendation | 1.65 (Moderate Buy) |
OGE Energy Corp (OGE) Company Bio
OGE Energy operates as an energy and energy services provider that offers physical delivery and related services for electricity and natural gas primarily in the south central United States. The company was founded in 1995 and is based in Oklahoma City, Oklahoma.
Latest OGE News From Around the Web
Below are the latest news stories about OGE ENERGY CORP that investors may wish to consider to help them evaluate OGE as an investment opportunity.
OGE vs. NEE: Which Stock Is the Better Value Option?OGE vs. NEE: Which Stock Is the Better Value Option? |
NRG Energy (NRG) Rides on Acquisition, Diverse Customer BaseNRG Energy's (NRG) diverse customer base and long-term customer retention strategy increase the predictability of earnings. Its dividend policy boosts shareholders' value. |
OGE Energy (NYSE:OGE) Has Affirmed Its Dividend Of $0.4141The board of OGE Energy Corp. ( NYSE:OGE ) has announced that it will pay a dividend of $0.4141 per share on the 28th... |
OGE Energy's solid execution and continued community growth deliver strong shareholder resultsOGE Energy Corp. (NYSE: OGE) virtually held its 2023 Annual Meeting of Shareholders today, electing its board of directors and acting on a number of items. |
16 Most Profitable Value Stocks NowIn this article, we will take a look at the 16 most profitable value stocks now. To see more such companies, go directly to 5 Most Profitable Value Stocks Now. Value stocks were clear winners in 2022. As inflation spiked and the Federal Reserve started to boost interest rates, investors fled risky stocks with huge […] |
OGE Price Returns
1-mo | -2.91% |
3-mo | 0.90% |
6-mo | -7.89% |
1-year | -9.18% |
3-year | 27.59% |
5-year | 28.89% |
YTD | -7.68% |
2022 | 7.58% |
2021 | 26.54% |
2020 | -24.91% |
2019 | 17.53% |
2018 | 23.91% |
OGE Dividends
Ex-Dividend Date | Type | Payout Amount | Change | ||||||
---|---|---|---|---|---|---|---|---|---|
Loading, please wait... |
Continue Researching OGE
Want to do more research on Oge Energy Corp's stock and its price? Try the links below:Oge Energy Corp (OGE) Stock Price | Nasdaq
Oge Energy Corp (OGE) Stock Quote, History and News - Yahoo Finance
Oge Energy Corp (OGE) Stock Price and Basic Information | MarketWatch
Loading social stream, please wait...