ONE Gas, Inc. (OGS): Price and Financial Metrics
OGS Price/Volume Stats
Current price | $79.97 | 52-week high | $89.01 |
Prev. close | $81.38 | 52-week low | $68.86 |
Day low | $79.46 | Volume | 398,200 |
Day high | $81.82 | Avg. volume | 513,710 |
50-day MA | $80.05 | Dividend yield | 3.27% |
200-day MA | $78.84 | Market Cap | 4.43B |
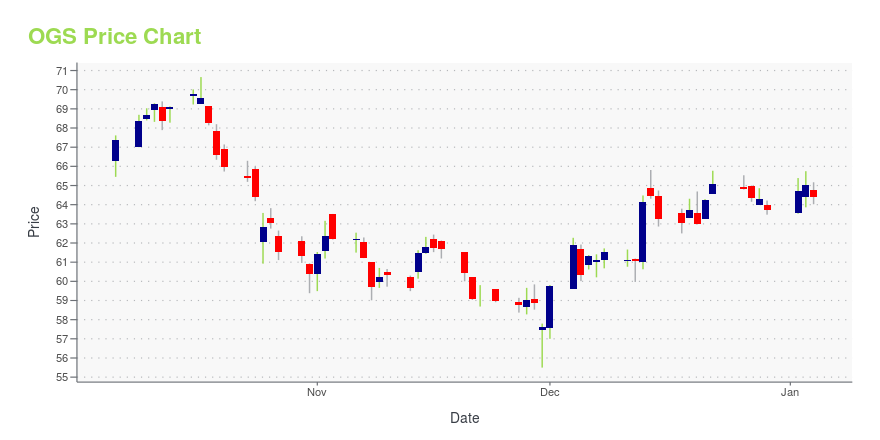
OGS Stock Price Chart Interactive Chart >
OGS POWR Grades
- OGS scores best on the Value dimension, with a Value rank ahead of 78.08% of US stocks.
- The strongest trend for OGS is in Growth, which has been heading down over the past 179 days.
- OGS's current lowest rank is in the Sentiment metric (where it is better than 12.2% of US stocks).
OGS Stock Summary
- The price/operating cash flow metric for ONE GAS INC is higher than just 10.51% of stocks in our set with a positive cash flow.
- In terms of volatility of its share price, OGS is more volatile than merely 1.6% of stocks we're observing.
- Shareholder yield, a measure of how much is returned to shareholders via dividends and share repurchases, for OGS comes in at 28.32% -- higher than that of 93.44% of stocks in our set.
- If you're looking for stocks that are quantitatively similar to ONE GAS INC, a group of peers worth examining would be CLH, TDS, VAC, ALGT, and ACCO.
- Visit OGS's SEC page to see the company's official filings. To visit the company's web site, go to www.onegas.com.
OGS Valuation Summary
- In comparison to the median Utilities stock, OGS's price/sales ratio is 8.11% lower, now standing at 1.7.
- OGS's price/sales ratio has moved up 0.5 over the prior 114 months.
Below are key valuation metrics over time for OGS.
Stock | Date | P/S | P/B | P/E | EV/EBIT |
---|---|---|---|---|---|
OGS | 2023-05-17 | 1.7 | 1.7 | 19.6 | 17.1 |
OGS | 2023-05-16 | 1.7 | 1.7 | 19.4 | 17.0 |
OGS | 2023-05-15 | 1.7 | 1.7 | 19.8 | 17.2 |
OGS | 2023-05-12 | 1.7 | 1.7 | 20.1 | 17.4 |
OGS | 2023-05-11 | 1.7 | 1.7 | 19.9 | 17.3 |
OGS | 2023-05-10 | 1.7 | 1.7 | 20.0 | 17.3 |
OGS Growth Metrics
- The 5 year net income to common stockholders growth rate now stands at 21.71%.
- Its year over year net cashflow from operations growth rate is now at 115.65%.
- The 4 year revenue growth rate now stands at 3.45%.

The table below shows OGS's growth in key financial areas (numbers in millions of US dollars).
Date | Revenue | Operating Cash Flow | Net Income to Common Stock |
---|---|---|---|
2022-12-31 | 2,578.005 | 1,570.842 | 221.742 |
2022-09-30 | 2,353.532 | 1,580.746 | 215.222 |
2022-06-30 | 2,268.092 | 328.368 | 211.774 |
2022-03-31 | 2,154.763 | 231.244 | 209.792 |
2021-12-31 | 1,808.597 | -1,535.657 | 206.434 |
2021-09-30 | 1,699.035 | -1,521.406 | 204.252 |
OGS's Quality Factors
The “Quality” component of the POWR Ratings focuses on 31 different factors of a companies fundamentals and operational strength. Here are some key insights as we drill into the specifics of these quality attributes.- OGS has a Quality Grade of D, ranking ahead of 9.84% of graded US stocks.
- OGS's asset turnover comes in at 0.219 -- ranking 48th of 105 Utilities stocks.
- LNT, PPL, and ORA are the stocks whose asset turnover ratios are most correlated with OGS.
The table below shows OGS's key quality metrics over time.
Period | Asset Turnover | Gross Margin | ROIC |
---|---|---|---|
2021-09-30 | 0.219 | 0.602 | 0.036 |
2021-06-30 | 0.233 | 0.607 | 0.040 |
2021-03-31 | 0.249 | 0.616 | 0.046 |
2020-12-31 | 0.264 | 0.649 | 0.053 |
2020-09-30 | 0.263 | 0.653 | 0.054 |
2020-06-30 | 0.266 | 0.648 | 0.054 |
OGS Price Target
For more insight on analysts targets of OGS, see our OGS price target page. And for a list of of all stocks sorted by upside potential based on analyst target price, see our Top Price Target page.
Average Price Target | $79.50 | Average Broker Recommendation | 1.88 (Hold) |
ONE Gas, Inc. (OGS) Company Bio
One Gas Inc. provides natural gas distribution services approximately to customers in Oklahoma, Kansas and Texas. The company was established in 2014 and is based in Tulsa, Oklahoma.
Latest OGS News From Around the Web
Below are the latest news stories about ONE GAS INC that investors may wish to consider to help them evaluate OGS as an investment opportunity.
ONE Gas (NYSE:OGS) Has More To Do To Multiply In Value Going ForwardIf we want to find a potential multi-bagger, often there are underlying trends that can provide clues. Firstly, we'll... |
Why Is ONE Gas (OGS) Up 4% Since Last Earnings Report?ONE Gas (OGS) reported earnings 30 days ago. What's next for the stock? We take a look at earnings estimates for some clues. |
ONE Gas (OGS) to Gain From Investments & Regulated OperationONE Gas (OGS) is expected to benefit from its 100% regulated operation, planned capital expenditures and growth in residential customers. |
Are You a Value Investor? This 1 Stock Could Be the Perfect PickWondering how to pick strong, market-beating stocks for your investment portfolio? Look no further than the Zacks Style Scores. |
ONE Gas, Inc. (NYSE:OGS) Will Pay A US$0.65 Dividend In Four DaysIt looks like ONE Gas, Inc. ( NYSE:OGS ) is about to go ex-dividend in the next four days. The ex-dividend date occurs... |
OGS Price Returns
1-mo | -0.15% |
3-mo | 3.83% |
6-mo | 5.46% |
1-year | -5.62% |
3-year | 5.78% |
5-year | 29.27% |
YTD | 7.34% |
2022 | 0.63% |
2021 | 4.36% |
2020 | -15.73% |
2019 | 20.26% |
2018 | 11.40% |
OGS Dividends
Ex-Dividend Date | Type | Payout Amount | Change | ||||||
---|---|---|---|---|---|---|---|---|---|
Loading, please wait... |
Continue Researching OGS
Here are a few links from around the web to help you further your research on ONE Gas Inc's stock as an investment opportunity:ONE Gas Inc (OGS) Stock Price | Nasdaq
ONE Gas Inc (OGS) Stock Quote, History and News - Yahoo Finance
ONE Gas Inc (OGS) Stock Price and Basic Information | MarketWatch
Loading social stream, please wait...