Universal Display Corporation (OLED): Price and Financial Metrics


Universal Display Corporation (OLED): $152.33

3.90 (+2.63%)

POWR Rating

Component Grades

Growth

S

Value

I

Momentum

G

Stability

N

Sentiment

U

Quality

P

OLED POWR Grades

  • OLED scores best on the Sentiment dimension, with a Sentiment rank ahead of 91.04% of US stocks.
  • OLED's strongest trending metric is Stability; it's been moving up over the last 177 days.
  • OLED ranks lowest in Value; there it ranks in the 11th percentile.

OLED Stock Summary

  • Price to trailing twelve month operating cash flow for OLED is currently 54.43, higher than 92.78% of US stocks with positive operating cash flow.
  • The ratio of debt to operating expenses for UNIVERSAL DISPLAY CORP is higher than it is for about just 0.44% of US stocks.
  • OLED's price/sales ratio is 11.19; that's higher than the P/S ratio of 90.75% of US stocks.
  • Stocks that are quantitatively similar to OLED, based on their financial statements, market capitalization, and price volatility, are ABSI, API, MTSI, ZLAB, and VYNE.
  • OLED's SEC filings can be seen here. And to visit UNIVERSAL DISPLAY CORP's official web site, go to oled.com.

OLED Valuation Summary

  • OLED's EV/EBIT ratio is 25.5; this is 33.51% higher than that of the median Technology stock.
  • OLED's price/earnings ratio has moved up 38.1 over the prior 243 months.

Below are key valuation metrics over time for OLED.

Stock Date P/S P/B P/E EV/EBIT
OLED 2023-03-21 11.2 5.4 32.9 25.5
OLED 2023-03-20 11.1 5.4 32.6 25.2
OLED 2023-03-17 10.9 5.3 32.0 24.7
OLED 2023-03-16 11.0 5.3 32.3 25.0
OLED 2023-03-15 10.6 5.1 31.0 23.9
OLED 2023-03-14 10.9 5.3 31.9 24.6

OLED Growth Metrics

    The 3 year price growth rate now stands at -17.23%.
  • Its 4 year net cashflow from operations growth rate is now at 102.52%.
  • Its 2 year revenue growth rate is now at 32.65%.
Over the past 15 months, OLED's revenue has gone up $71,552,000.

The table below shows OLED's growth in key financial areas (numbers in millions of US dollars).

Date Revenue Operating Cash Flow Net Income to Common Stock
2022-09-30 593.834 180.953 190.803
2022-06-30 576.896 218.119 183.457
2022-03-31 569.995 214.217 182.496
2021-12-31 553.525 191.105 184.213
2021-09-30 548.821 207.291 192.239
2021-06-30 522.282 175.878 186.63

OLED's Quality Factors

The “Quality” component of the POWR Ratings focuses on 31 different factors of a companies fundamentals and operational strength. Here are some key insights as we drill into the specifics of these quality attributes.
  • OLED has a Quality Grade of B, ranking ahead of 87.1% of graded US stocks.
  • OLED's asset turnover comes in at 0.41 -- ranking 158th of 208 Electronic Equipment stocks.
  • OTIVF, CLRD, and NEON are the stocks whose asset turnover ratios are most correlated with OLED.

The table below shows OLED's key quality metrics over time.

Period Asset Turnover Gross Margin ROIC
2021-09-30 0.410 0.794 0.503
2021-06-30 0.405 0.793 0.451
2021-03-31 0.363 0.791 0.322
2020-12-31 0.358 0.775 0.254
2020-09-30 0.335 0.774 0.184
2020-06-30 0.330 0.780 0.190

OLED Price Target

For more insight on analysts targets of OLED, see our OLED price target page. And for a list of of all stocks sorted by upside potential based on analyst target price, see our Top Price Target page.

Average Price Target $251.00 Average Broker Recommendation 1.54 (Moderate Buy)

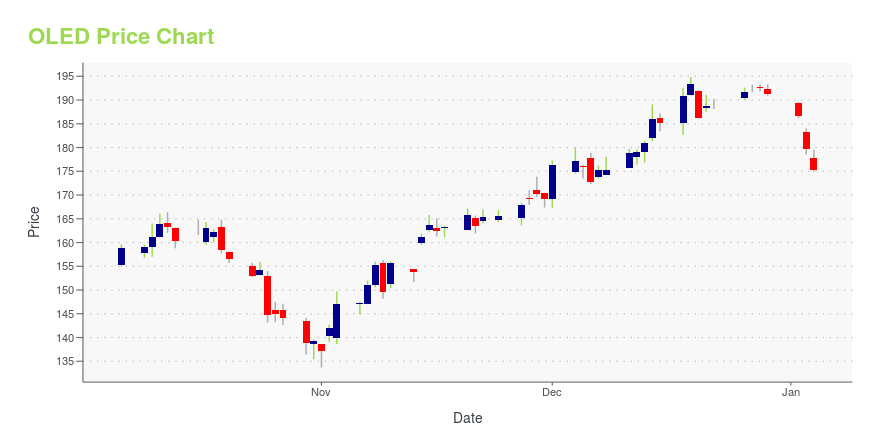
OLED Stock Price Chart Interactive Chart >

Price chart for OLED

OLED Price/Volume Stats

Current price $152.33 52-week high $176.41
Prev. close $148.43 52-week low $89.41
Day low $149.27 Volume 154,636
Day high $152.88 Avg. volume 330,295
50-day MA $137.32 Dividend yield 0.97%
200-day MA $115.86 Market Cap 7.20B

Universal Display Corporation (OLED) Company Bio


Universal Display Corporation is a leader in developing and delivering state-of-the-art, organic light emitting diode technologies, materials and services to the display and lighting industries. The company was founded in 1985 and is based in Ewing, New Jersey.


OLED Latest News Stream


Event/Time News Detail
Loading, please wait...

OLED Latest Social Stream


Loading social stream, please wait...

View Full OLED Social Stream

Latest OLED News From Around the Web

Below are the latest news stories about UNIVERSAL DISPLAY CORP that investors may wish to consider to help them evaluate OLED as an investment opportunity.

Universal Display Corporation Sponsors and Presents at ICDT 2023

EWING, N.J., March 28, 2023--Universal Display Corporation announced its sponsorship & presentation at the International Conference on Display Technology (ICDT) (2023国际显示技术大会).

Yahoo | March 28, 2023

OSIS vs. OLED: Which Stock Is the Better Value Option?

OSIS vs. OLED: Which Stock Is the Better Value Option?

Yahoo | March 28, 2023

Is There Now An Opportunity In Universal Display Corporation (NASDAQ:OLED)?

Universal Display Corporation ( NASDAQ:OLED ), is not the largest company out there, but it led the NASDAQGS gainers...

Yahoo | March 27, 2023

The Hidden Winner of Samsung's OLED-TV Strategy Shift

This year, the Korean electronics giant is adding a midpriced option to its usual lineup of high-end OLED TVs. Here's how to invest in what happens next. (Hint: Samsung is not the stock to buy here.)

Yahoo | March 21, 2023

Let's Shine a Light on Organic Light Emitting Diodes and a Major Tech Stock

The Apple rumor mill is also back in action with talk of new iPad models with an organic light emitting diode screen that would lead to higher price points but also growing speculation its first-generation AR/ VR headsets could be debuted at 2023 WWDC in June. Unlike some chip companies such as Skyworks , Qualcomm and Qorvo that risk getting boxed out as Apple shifts to its Apple Silicon solutions, Universal Display sells organic light emitting diode materials and leverages its intellectual patent portfolio for OLEDs as well.

Yahoo | March 13, 2023

Read More 'OLED' Stories Here

OLED Price Returns

1-mo 12.42%
3-mo 41.35%
6-mo 62.28%
1-year -9.22%
3-year 13.07%
5-year 54.54%
YTD 41.35%
2022 -33.87%
2021 -27.89%
2020 11.91%
2019 120.74%
2018 -45.69%

OLED Dividends

Ex-Dividend Date Type Payout Amount Change
Loading, please wait...
View Full OLED Dividend History

Continue Researching OLED

Want to see what other sources are saying about Universal Display Corp's financials and stock price? Try the links below:

Universal Display Corp (OLED) Stock Price | Nasdaq
Universal Display Corp (OLED) Stock Quote, History and News - Yahoo Finance
Universal Display Corp (OLED) Stock Price and Basic Information | MarketWatch

Get Free Updates

Join thousands of investors who get the latest news, insights and top rated picks from StockNews.com!


Page generated in 0.8953 seconds.