Olin Corporation (OLN): Price and Financial Metrics

Olin Corporation (OLN): $51.35

2.98 (+6.16%)

POWR Rating

Component Grades

Momentum

C

Stability

C

Sentiment

Quality

B

Add OLN to Watchlist
Sign Up

Industry: Chemicals

Industry

C

Ranked

#24 of 84

in industry

OLN Price/Volume Stats

Current price $51.35 52-week high $66.53
Prev. close $48.37 52-week low $41.33
Day low $49.34 Volume 1,516,400
Day high $51.86 Avg. volume 1,416,964
50-day MA $54.12 Dividend yield 1.69%
200-day MA $54.31 Market Cap 6.64B

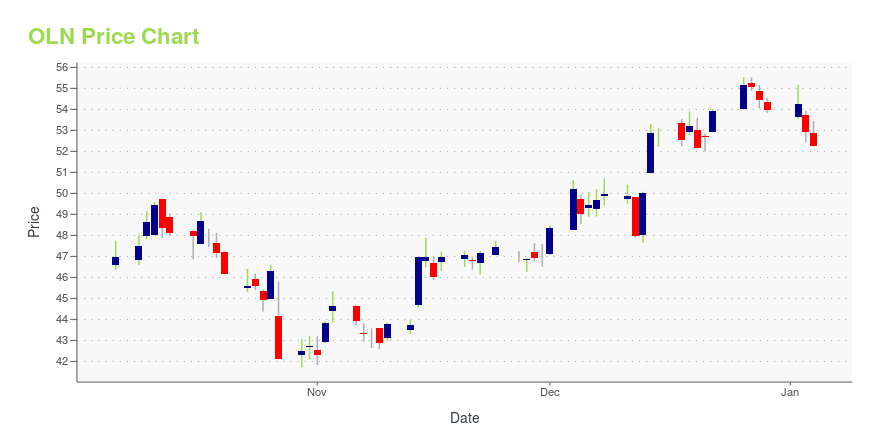
OLN Stock Price Chart Interactive Chart >

OLN POWR Grades

  • Quality is the dimension where OLN ranks best; there it ranks ahead of 94.8% of US stocks.
  • OLN's strongest trending metric is Sentiment; it's been moving up over the last 179 days.
  • OLN's current lowest rank is in the Growth metric (where it is better than 10.86% of US stocks).

OLN Stock Summary

  • OLN's went public 35.42 years ago, making it older than 90.88% of listed US stocks we're tracking.
  • The ratio of debt to operating expenses for OLIN CORP is higher than it is for about 86.4% of US stocks.
  • OLIN CORP's shareholder yield -- a measure of how much capital is returned to stockholders via dividends and buybacks -- is 20.33%, greater than the shareholder yield of 90.77% of stocks in our set.
  • Stocks that are quantitatively similar to OLN, based on their financial statements, market capitalization, and price volatility, are HRI, PTVE, TGNA, WSC, and PPC.
  • Visit OLN's SEC page to see the company's official filings. To visit the company's web site, go to www.olin.com.

OLN Valuation Summary

  • OLN's price/earnings ratio is 6.3; this is 51.16% lower than that of the median Basic Materials stock.
  • OLN's price/earnings ratio has moved up 23.2 over the prior 243 months.

Below are key valuation metrics over time for OLN.

Stock Date P/S P/B P/E EV/EBIT
OLN 2023-05-17 0.8 2.7 6.3 6.5
OLN 2023-05-16 0.8 2.7 6.1 6.4
OLN 2023-05-15 0.8 2.8 6.3 6.5
OLN 2023-05-12 0.8 2.7 6.2 6.5
OLN 2023-05-11 0.8 2.7 6.3 6.5
OLN 2023-05-10 0.8 2.8 6.4 6.6

OLN Growth Metrics

    Its 3 year price growth rate is now at 178.1%.
  • Its 3 year cash and equivalents growth rate is now at 87.23%.
  • The 4 year cash and equivalents growth rate now stands at 15.43%.
OLN's revenue has moved up $3,394,500,000 over the prior 34 months.

The table below shows OLN's growth in key financial areas (numbers in millions of US dollars).

Date Revenue Operating Cash Flow Net Income to Common Stock
2022-12-31 9,376.2 1,921.9 1,326.9
2022-09-30 9,829.6 1,999 1,436.9
2022-06-30 9,848 1,992.6 1,512.4
2022-03-31 9,453.2 1,843.4 1,446.1
2021-12-31 8,910.6 1,741 1,296.7
2021-09-30 8,134.3 1,364.8 957.1

OLN's Quality Factors

The “Quality” component of the POWR Ratings focuses on 31 different factors of a companies fundamentals and operational strength. Here are some key insights as we drill into the specifics of these quality attributes.
  • OLN has a Quality Grade of B, ranking ahead of 92.36% of graded US stocks.
  • OLN's asset turnover comes in at 0.956 -- ranking 16th of 89 Chemicals stocks.
  • LXU, MOS, and KRA are the stocks whose asset turnover ratios are most correlated with OLN.

The table below shows OLN's key quality metrics over time.

Period Asset Turnover Gross Margin ROIC
2021-09-30 0.956 0.229 0.160
2021-06-30 0.860 0.184 0.022
2021-03-31 0.736 0.132 -0.031
2020-12-31 0.664 0.067 -0.078
2020-09-30 0.617 0.055 -0.093
2020-06-30 0.616 0.070 -0.008

OLN Price Target

For more insight on analysts targets of OLN, see our OLN price target page. And for a list of of all stocks sorted by upside potential based on analyst target price, see our Top Price Target page.

Average Price Target $62.71 Average Broker Recommendation 1.42 (Moderate Buy)

Olin Corporation (OLN) Company Bio


Olin Corporation produces chlorine and caustic soda, hydrochloric acid, hydrogen, bleach products and potassium hydroxide. Chemical Distribution manufactures bleach products and distributes caustic soda, bleach products, potassium hydroxide and hydrochloric acid. The company was founded in 1892 and is based in Clayton, Missouri.


OLN Latest News Stream


Event/Time News Detail
Loading, please wait...

OLN Latest Social Stream


Loading social stream, please wait...

View Full OLN Social Stream

Latest OLN News From Around the Web

Below are the latest news stories about OLIN CORP that investors may wish to consider to help them evaluate OLN as an investment opportunity.

Here's What We Like About Olin's (NYSE:OLN) Upcoming Dividend

Readers hoping to buy Olin Corporation ( NYSE:OLN ) for its dividend will need to make their move shortly, as the stock...

Yahoo | May 5, 2023

Olin's (OLN) Earnings and Revenues Miss Estimates in Q1

Lower volumes in its chemical businesses hurt Olin's (OLN) Q1 top line.

Yahoo | May 3, 2023

Olin (NYSE:OLN) Is Due To Pay A Dividend Of $0.20

Olin Corporation ( NYSE:OLN ) has announced that it will pay a dividend of $0.20 per share on the 9th of June. This...

Yahoo | May 1, 2023

Q1 2023 Olin Corp Earnings Call

Q1 2023 Olin Corp Earnings Call

Yahoo | April 29, 2023

Olin (OLN) Misses Q1 Earnings and Revenue Estimates

Olin (OLN) delivered earnings and revenue surprises of -9.38% and 6.89%, respectively, for the quarter ended March 2023. Do the numbers hold clues to what lies ahead for the stock?

Yahoo | April 27, 2023

Read More 'OLN' Stories Here

OLN Price Returns

1-mo -3.85%
3-mo -14.39%
6-mo -6.03%
1-year -20.72%
3-year 311.09%
5-year 85.11%
YTD -2.32%
2022 -6.63%
2021 138.55%
2020 50.81%
2019 -10.77%
2018 -41.88%

OLN Dividends

Ex-Dividend Date Type Payout Amount Change
Loading, please wait...
View Full OLN Dividend History

Get Free Updates

Join thousands of investors who get the latest news, insights and top rated picks from StockNews.com!