Ooma, Inc. (OOMA): Price and Financial Metrics
OOMA Price/Volume Stats
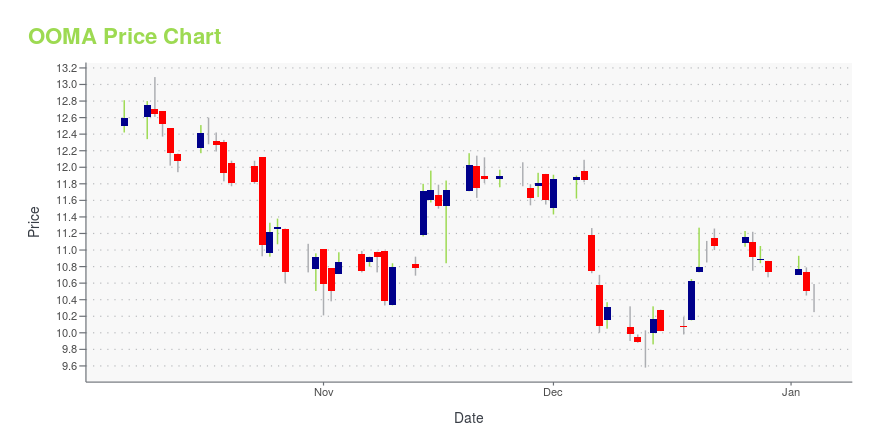
Current price | $13.07 | 52-week high | $16.76 |
Prev. close | $13.13 | 52-week low | $10.82 |
Day low | $12.94 | Volume | 67,780 |
Day high | $13.29 | Avg. volume | 84,716 |
50-day MA | $12.70 | Dividend yield | N/A |
200-day MA | $13.58 | Market Cap | 330.92M |
OOMA Stock Price Chart Interactive Chart >
OOMA POWR Grades
- OOMA scores best on the Growth dimension, with a Growth rank ahead of 94.86% of US stocks.
- The strongest trend for OOMA is in Stability, which has been heading up over the past 179 days.
- OOMA's current lowest rank is in the Momentum metric (where it is better than 38.9% of US stocks).
OOMA Stock Summary
- The price/operating cash flow metric for OOMA INC is higher than 88.87% of stocks in our set with a positive cash flow.
- For OOMA, its debt to operating expenses ratio is greater than that reported by merely 12.85% of US equities we're observing.
- In terms of twelve month growth in earnings before interest and taxes, OOMA INC is reporting a growth rate of 209.82%; that's higher than 93.31% of US stocks.
- Stocks with similar financial metrics, market capitalization, and price volatility to OOMA INC are DIOD, RDWR, SCWX, ATEN, and HRMY.
- Visit OOMA's SEC page to see the company's official filings. To visit the company's web site, go to www.ooma.com.
OOMA Valuation Summary
- In comparison to the median Communication Services stock, OOMA's price/sales ratio is 20% lower, now standing at 1.6.
- OOMA's price/earnings ratio has moved down 81.5 over the prior 95 months.
Below are key valuation metrics over time for OOMA.
Stock | Date | P/S | P/B | P/E | EV/EBIT |
---|---|---|---|---|---|
OOMA | 2023-05-19 | 1.6 | 5.5 | -98.5 | -61.2 |
OOMA | 2023-05-18 | 1.6 | 5.6 | -99.7 | -62.0 |
OOMA | 2023-05-17 | 1.6 | 5.6 | -101.0 | -62.8 |
OOMA | 2023-05-16 | 1.6 | 5.6 | -100.9 | -62.8 |
OOMA | 2023-05-15 | 1.6 | 5.5 | -98.1 | -61.0 |
OOMA | 2023-05-12 | 1.5 | 5.4 | -96.1 | -59.7 |
OOMA Growth Metrics
- Its 5 year net income to common stockholders growth rate is now at -22.14%.
- Its 5 year price growth rate is now at 67.65%.
- The 4 year net income to common stockholders growth rate now stands at -22.14%.

The table below shows OOMA's growth in key financial areas (numbers in millions of US dollars).
Date | Revenue | Operating Cash Flow | Net Income to Common Stock |
---|---|---|---|
2022-09-30 | 210.158 | 7.254 | -3.337 |
2022-06-30 | 202.651 | 6.643 | -0.853 |
2022-03-31 | 197.055 | 7.05 | -1.63 |
2021-12-31 | 192.29 | 6.655 | -1.751 |
2021-09-30 | 186.063 | 7.075 | -2.247 |
2021-06-30 | 179.858 | 7.696 | -2.334 |
OOMA's Quality Factors
The “Quality” component of the POWR Ratings focuses on 31 different factors of a companies fundamentals and operational strength. Here are some key insights as we drill into the specifics of these quality attributes.- OOMA has a Quality Grade of C, ranking ahead of 52.06% of graded US stocks.
- OOMA's asset turnover comes in at 1.954 -- ranking 37th of 563 Business Services stocks.
- SCWX, APPN, and CSGS are the stocks whose asset turnover ratios are most correlated with OOMA.
The table below shows OOMA's key quality metrics over time.
Period | Asset Turnover | Gross Margin | ROIC |
---|---|---|---|
2021-07-31 | 1.954 | 0.620 | -0.095 |
2021-04-30 | 2.017 | 0.618 | -0.114 |
2021-01-31 | 2.014 | 0.620 | -0.122 |
2020-10-31 | 2.022 | 0.617 | -0.224 |
2020-07-31 | 2.024 | 0.601 | -0.628 |
2020-04-30 | 1.982 | 0.596 | -1.098 |
Ooma, Inc. (OOMA) Company Bio
Ooma Inc. provides communications solutions and other connected services to small business, and home and mobile users in the United States and Canadian markets. The company was founded in 2003 and is based in Palo Alto, California.
Latest OOMA News From Around the Web
Below are the latest news stories about OOMA INC that investors may wish to consider to help them evaluate OOMA as an investment opportunity.
Q1 2024 Ooma Inc Earnings CallQ1 2024 Ooma Inc Earnings Call |
Ooma (OOMA) Q1 Earnings and Revenues Top EstimatesOoma (OOMA) delivered earnings and revenue surprises of 23.08% and 0.62%, respectively, for the quarter ended April 2023. Do the numbers hold clues to what lies ahead for the stock? |
Ooma Reports Fiscal First Quarter 2024 Financial ResultsSUNNYVALE, Calif., May 23, 2023--Ooma, Inc. (NYSE: OOMA), a smart communications platform for businesses and consumers, today released financial results for the fiscal first quarter ended April 30, 2023. |
Ooma and NexHealth Partner to Help Dental Practices Make Patient Phone Calls More PersonalSUNNYVALE, Calif., May 22, 2023--Ooma, Inc., a smart communications platform for businesses and consumers, today announced a partnership with NexHealth, the leading patient experience platform, to help dental practices make patient phone calls more personal. Dental care teams can now use the NexHealth Synchronizer™ to sync patient information from practice management systems with the Ooma Office business phone service so staff can view patient details in real time when taking or making phone cal |
Ooma to Attend the 43rd Annual William Blair Growth Stock ConferenceSUNNYVALE, Calif., May 16, 2023--Ooma, Inc. (NYSE: OOMA), a smart communications platform for businesses and consumers, today announced the following conference participation: |
OOMA Price Returns
1-mo | 9.10% |
3-mo | 0.93% |
6-mo | -10.17% |
1-year | -5.01% |
3-year | -4.81% |
5-year | 10.76% |
YTD | -4.04% |
2022 | -33.37% |
2021 | 41.94% |
2020 | 8.84% |
2019 | -4.68% |
2018 | 16.15% |
Continue Researching OOMA
Want to do more research on Ooma Inc's stock and its price? Try the links below:Ooma Inc (OOMA) Stock Price | Nasdaq
Ooma Inc (OOMA) Stock Quote, History and News - Yahoo Finance
Ooma Inc (OOMA) Stock Price and Basic Information | MarketWatch
Loading social stream, please wait...