
Old Point Financial Corporation (OPOF): Price and Financial Metrics
OPOF Price/Volume Stats
| Current price | $18.03 | 52-week high | $22.33 |
| Prev. close | $17.05 | 52-week low | $13.49 |
| Day low | $17.60 | Volume | 3,000 |
| Day high | $18.24 | Avg. volume | 5,432 |
| 50-day MA | $15.12 | Dividend yield | 3.27% |
| 200-day MA | $16.33 | Market Cap | 91.52M |
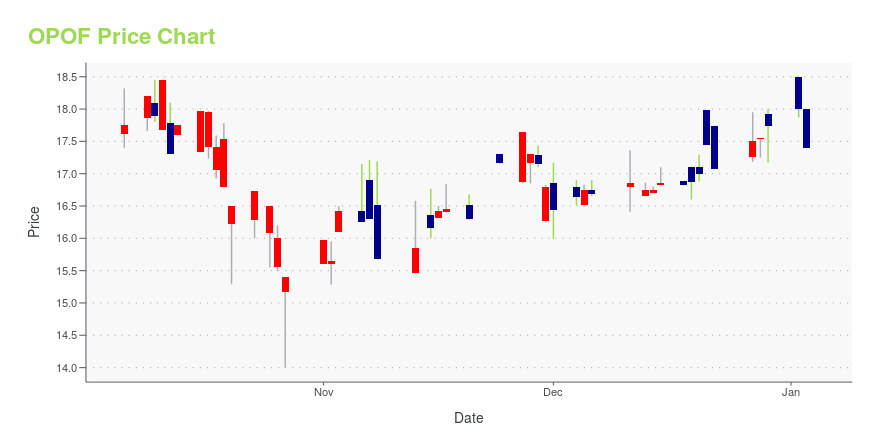
OPOF Stock Price Chart Interactive Chart >
Old Point Financial Corporation (OPOF) Company Bio
Old Point Financial Corporation operates as the holding company for The Old Point National Bank of Phoebus that provides consumer, mortgage, and business banking services for individual and commercial customers in Virginia. The company was founded in 1922 and is based in Hampton, Virginia.
Latest OPOF News From Around the Web
Below are the latest news stories about OLD POINT FINANCIAL CORP that investors may wish to consider to help them evaluate OPOF as an investment opportunity.
OLD POINT FINANCIAL CORPORATION ANNOUNCES RETIREMENT OF DR. ARTHUR D. GREENE FROM BOARD OF DIRECTORSOld Point Financial Corporation (the Company) announced that Dr. Arthur D. Greene is retiring from the Boards of Directors of the Company and its wholly-owned subsidiaries, The Old Point National Bank of Phoebus (the Bank) and Old Point Trust & Financial Services, N.A. (the Wealth Company) effective as of December 31, 2023. Dr. Greene joined the Boards of Directors of the Company, Bank, and the Wealth Company in 1994 and currently serves on the Company's Executive, Audit, and Nominating and Corp |
Old Point Financial Corporation (NASDAQ:OPOF) Passed Our Checks, And It's About To Pay A US$0.14 DividendSome investors rely on dividends for growing their wealth, and if you're one of those dividend sleuths, you might be... |
Old Point Financial Corporation Declares Quarterly DividendOld Point Financial Corporation declared a quarterly cash dividend of $0.14 per share on its common stock to be paid on December 29, 2023 to shareholders of record as of December 6, 2023. This dividend amount is the same as the prior quarter's dividend and based on the stock's closing price of $17.75 on November 21, 2023, the annual dividend yield is approximately 3.15%. |
Old Point Releases Third Quarter 2023 ResultsOld Point Financial Corporation (the Company or Old Point) (NASDAQ "OPOF") reported net income of $1.4 million and earnings per diluted common share of $0.27 for the third quarter of 2023 compared to net income of $2.5 million and earnings per diluted common share of $0.51 for the third quarter of 2022. Net income for the nine months ended September 30, 2023 and 2022 was $6.2 million, or $1.24 earnings per diluted common share, and $6.5 million, or $1.27 earnings per diluted common share, respec |
OLD POINT ANNOUNCES APPOINTMENT OF PAUL M. PICKETT AS CHIEF FINANCIAL OFFICERPaul M. Pickett has been appointed Senior Vice President and Chief Financial Officer of Old Point Financial Corporation (NASDAQ: OPOF) and Executive Vice President and Chief Financial Officer of Old Point National Bank effective October 24, 2023. |
OPOF Price Returns
| 1-mo | 27.42% |
| 3-mo | 25.10% |
| 6-mo | -0.03% |
| 1-year | -11.69% |
| 3-year | N/A |
| 5-year | -9.15% |
| YTD | 2.37% |
| 2023 | -31.57% |
| 2022 | 18.09% |
| 2021 | 26.05% |
| 2020 | -29.12% |
| 2019 | 28.48% |
OPOF Dividends
| Ex-Dividend Date | Type | Payout Amount | Change | ||||||
|---|---|---|---|---|---|---|---|---|---|
| Loading, please wait... | |||||||||
Continue Researching OPOF
Want to see what other sources are saying about Old Point Financial Corp's financials and stock price? Try the links below:Old Point Financial Corp (OPOF) Stock Price | Nasdaq
Old Point Financial Corp (OPOF) Stock Quote, History and News - Yahoo Finance
Old Point Financial Corp (OPOF) Stock Price and Basic Information | MarketWatch
Loading social stream, please wait...