Oppenheimer Holdings, Inc. (DE) (OPY): Price and Financial Metrics

Oppenheimer Holdings, Inc. (DE) (OPY): $38.13

0.55 (+1.46%)

POWR Rating

Component Grades

Momentum

B

Stability

C

Sentiment

Quality

C

Add OPY to Watchlist
Sign Up

Industry: Investment Brokerage

Industry

D

Ranked

#1 of 20

in industry

OPY Price/Volume Stats
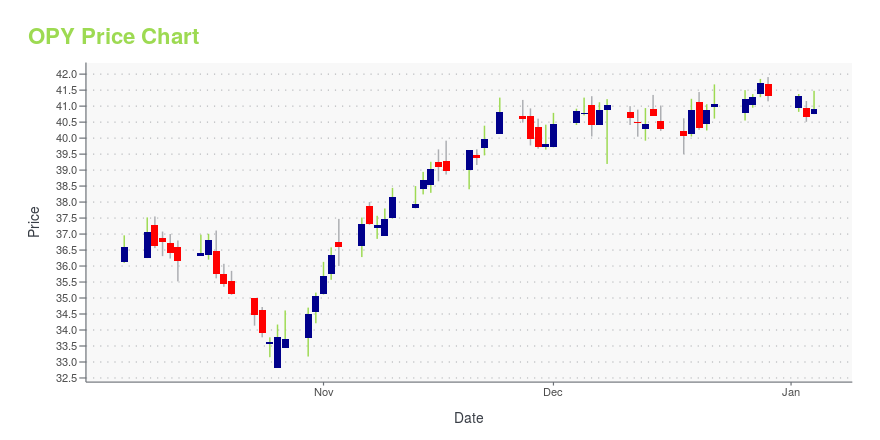
Current price $38.13 52-week high $49.32
Prev. close $37.58 52-week low $28.41
Day low $37.75 Volume 3,120
Day high $38.13 Avg. volume 66,663
50-day MA $38.51 Dividend yield 1.6%
200-day MA $40.46 Market Cap 402.31M

OPY Stock Price Chart Interactive Chart >

OPY POWR Grades

  • Momentum is the dimension where OPY ranks best; there it ranks ahead of 85.32% of US stocks.
  • OPY's strongest trending metric is Sentiment; it's been moving up over the last 177 days.
  • OPY's current lowest rank is in the Growth metric (where it is better than 45.38% of US stocks).

OPY Stock Summary

  • Price to trailing twelve month operating cash flow for OPY is currently 2.72, higher than only 9.62% of US stocks with positive operating cash flow.
  • With a price/sales ratio of 0.32, OPPENHEIMER HOLDINGS INC has a higher such ratio than merely 11.3% of stocks in our set.
  • Shareholder yield, a measure of how much is returned to shareholders via dividends and share repurchases, for OPY comes in at 31.1% -- higher than that of 93.85% of stocks in our set.
  • If you're looking for stocks that are quantitatively similar to OPPENHEIMER HOLDINGS INC, a group of peers worth examining would be AMN, BCC, SRCE, HTLF, and HUBG.
  • OPY's SEC filings can be seen here. And to visit OPPENHEIMER HOLDINGS INC's official web site, go to www.oppenheimer.com.

OPY Valuation Summary

  • OPY's price/earnings ratio is 12.5; this is 31.58% higher than that of the median Financial Services stock.
  • OPY's price/earnings ratio has moved down 5.4 over the prior 243 months.

Below are key valuation metrics over time for OPY.

Stock Date P/S P/B P/E EV/EBIT
OPY 2023-09-15 0.3 0.5 12.5 15.7
OPY 2023-09-14 0.3 0.5 12.6 15.8
OPY 2023-09-13 0.3 0.5 12.5 15.7
OPY 2023-09-12 0.3 0.5 12.6 15.7
OPY 2023-09-11 0.3 0.5 12.1 15.6
OPY 2023-09-08 0.3 0.5 12.4 15.7

OPY Growth Metrics

    Its 4 year revenue growth rate is now at 18.72%.
  • Its 2 year price growth rate is now at 52.41%.
  • The 3 year net cashflow from operations growth rate now stands at -67.66%.
Over the past 49 months, OPY's revenue has gone up $182,606,000.

The table below shows OPY's growth in key financial areas (numbers in millions of US dollars).

Date Revenue Operating Cash Flow Net Income to Common Stock
2022-09-30 1,162.479 9.494 72.835
2022-06-30 1,183.71 -23.725 94.565
2022-03-31 1,286.781 68.372 129.598
2021-12-31 1,394.035 227.786 158.964
2021-09-30 1,451.825 229.512 177.947
2021-06-30 1,412.742 -18.006 167.336

OPY's Quality Factors

The “Quality” component of the POWR Ratings focuses on 31 different factors of a companies fundamentals and operational strength. Here are some key insights as we drill into the specifics of these quality attributes.
  • OPY has a Quality Grade of B, ranking ahead of 84.1% of graded US stocks.
  • OPY's asset turnover comes in at 0.527 -- ranking 38th of 444 Trading stocks.
  • GBCS, HIW, and VALU are the stocks whose asset turnover ratios are most correlated with OPY.

The table below shows OPY's key quality metrics over time.

Period Asset Turnover Gross Margin ROIC
2021-09-30 0.527 0.985 0.077
2021-06-30 0.526 0.984 0.073
2021-03-31 0.514 0.982 0.068
2020-12-31 0.488 0.981 0.060
2020-09-30 0.448 0.978 0.037
2020-06-30 0.449 0.978 0.037

Oppenheimer Holdings, Inc. (DE) (OPY) Company Bio


Oppenheimer Holdings provides a full range of wealth management, securities brokerage and investment banking services to high-net-worth individuals, families, corporate executives, local governments, businesses and institutions. The company was founded in 1881 and is based in New York, New York.


OPY Latest News Stream


Event/Time News Detail
Loading, please wait...

OPY Latest Social Stream


Loading social stream, please wait...

View Full OPY Social Stream

Latest OPY News From Around the Web

Below are the latest news stories about OPPENHEIMER HOLDINGS INC that investors may wish to consider to help them evaluate OPY as an investment opportunity.

The 10 Best Invesco Mutual Funds to Buy Now

Invesco mutual funds offer investors a diverse range of investment options to help them achieve their financial goals. With a long-standing reputation and a wide variety of funds, Invesco has established itself as a trusted name in the investment industry.

Yahoo | September 15, 2023

Oppenheimer Announces Brand Relaunch

Oppenheimer & Co. Inc. ("Oppenheimer")—a leading wealth manager, investment bank, and a subsidiary of Oppenheimer Holdings (NYSE: OPY) — today announced the launch of a strategic brand initiative. The relaunch is accompanied by a multi-channel advertising campaign that demonstrates "The Power of Oppenheimer Thinking," a new tagline which underscores the firm's mission: to apply original thinking that anticipates and captures innovative investment opportunities that improve clients' outcomes.

Yahoo | September 13, 2023

Oppenheimer & Co. Inc. Announces Hiring of Distressed Debt Team

Oppenheimer & Co. Inc. ("Oppenheimer") – a leading investment bank, wealth manager, and a subsidiary of Oppenheimer Holdings (NYSE: OPY) – announced today a significant expansion to its Fixed Income Division with the addition of ten distressed debt team members.

Yahoo | September 7, 2023

How $2.2 Billion Barbenheimer Movie Haul Relates To Mortgage Biz

Barbenheimer mortgage comparison: in Hollywood, AI and streaming won't replace moviegoing just like AI and fintech won't replace smart advice.

Yahoo | September 6, 2023

Investing in Oppenheimer Holdings (NYSE:OPY) three years ago would have delivered you a 61% gain

One simple way to benefit from the stock market is to buy an index fund. But if you pick the right individual stocks...

Yahoo | September 1, 2023

Read More 'OPY' Stories Here

OPY Price Returns

1-mo -1.19%
3-mo -4.73%
6-mo -1.83%
1-year 23.89%
3-year 89.15%
5-year 38.49%
YTD -8.91%
2022 -6.83%
2021 52.69%
2020 20.41%
2019 9.39%
2018 -3.24%

OPY Dividends

Ex-Dividend Date Type Payout Amount Change
Loading, please wait...
View Full OPY Dividend History

Get Free Updates

Join thousands of investors who get the latest news, insights and top rated picks from StockNews.com!