
Ormat Technologies, Inc. (ORA): Price and Financial Metrics
ORA Price/Volume Stats
| Current price | $78.16 | 52-week high | $83.41 |
| Prev. close | $76.09 | 52-week low | $58.73 |
| Day low | $76.88 | Volume | 398,455 |
| Day high | $78.32 | Avg. volume | 477,274 |
| 50-day MA | $73.60 | Dividend yield | 0.63% |
| 200-day MA | $68.59 | Market Cap | 4.72B |
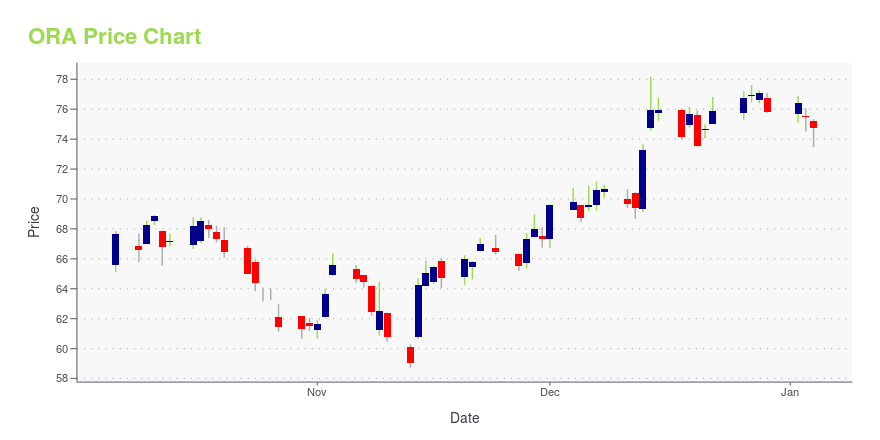
ORA Stock Price Chart Interactive Chart >
Ormat Technologies, Inc. (ORA) Company Bio
Ormat Technologies designs, develops, builds, owns and operates geothermal and recovered energy-based power plants. The Company's equipment manufacturing operations are located in Israel. The company was founded in 1965 and is based in Reno, Nevada.
Latest ORA News From Around the Web
Below are the latest news stories about ORMAT TECHNOLOGIES INC that investors may wish to consider to help them evaluate ORA as an investment opportunity.
Green Giants: 7 ESG Stocks Leading the Way in Sustainable InvestingInvest in ESG stocks amidst the growing demand for corporate accountability offering strong upside potential over the long-run. |
Top 10 Geothermal Energy Companies in the USIn this article, we will see the top 10 geothermal energy companies in the US. If you want to skip our detailed analysis of the geothermal energies market, you can go directly to the Top 5 Geothermal Energy Companies in the US. Geothermal energy is a renewable, reliable, and clean energy source, produced from the […] |
12 High Growth Utility Stocks to BuyIn this article, we will take a look at the 12 high growth utility stocks to buy. To skip our analysis of the recent market trends and activity, you can go directly to see the 5 High Growth Utility Stocks to Buy. The U.S. power and utilities industry maintained its focus on increasing its decarbonization […] |
12 Best Clean Energy Stocks To Buy According to BillionairesIn this piece, we will take a look at the 12 best clean energy stocks to buy according to billionaires. If you want to skip our overview of the clean energy industry and some recent news, then you can skip and read 5 Best Clean Energy Stocks To Buy According to Billionaires. Alongside biotechnology and […] |
Ormat Secures 15-Year Energy Storage Service Agreement With San Diego Community Power for Pomona 2 Energy Storage FacilityAgreement Supports SDCP’s Mission to Bring Clean, Reliable Energy to Its CustomersRENO, Nev., Dec. 12, 2023 (GLOBE NEWSWIRE) -- Ormat Technologies, Inc. (NYSE: ORA), a leading renewable energy company, announced the signing of a 15-year Energy Storage Service Agreement (ESSA) with San Diego Community Power (SDCP), California’s second largest community choice aggregator, for the 20MW/40MWh Pomona 2 Battery Energy Storage System (BESS) located in Los Angeles County, California. The Pomona 2 projec |
ORA Price Returns
| 1-mo | 7.02% |
| 3-mo | 24.06% |
| 6-mo | 20.50% |
| 1-year | -3.57% |
| 3-year | 14.42% |
| 5-year | 25.24% |
| YTD | 3.49% |
| 2023 | -11.82% |
| 2022 | 9.68% |
| 2021 | -11.59% |
| 2020 | 21.92% |
| 2019 | 43.44% |
ORA Dividends
| Ex-Dividend Date | Type | Payout Amount | Change | ||||||
|---|---|---|---|---|---|---|---|---|---|
| Loading, please wait... | |||||||||
Continue Researching ORA
Want to do more research on Ormat Technologies Inc's stock and its price? Try the links below:Ormat Technologies Inc (ORA) Stock Price | Nasdaq
Ormat Technologies Inc (ORA) Stock Quote, History and News - Yahoo Finance
Ormat Technologies Inc (ORA) Stock Price and Basic Information | MarketWatch
Loading social stream, please wait...