Open Text Corporation (OTEX): Price and Financial Metrics
GET POWR RATINGS... FREE!
OTEX POWR Grades
- Stability is the dimension where OTEX ranks best; there it ranks ahead of 88.47% of US stocks.
- OTEX's strongest trending metric is Growth; it's been moving up over the last 177 days.
- OTEX's current lowest rank is in the Momentum metric (where it is better than 21.86% of US stocks).
OTEX Stock Summary
- OPEN TEXT CORP's market capitalization of $8,988,023,883 is ahead of 82.25% of US-listed equities.
- OTEX's current price/earnings ratio is 60.63, which is higher than 90.19% of US stocks with positive earnings.
- Over the past twelve months, OTEX has reported earnings growth of -49.55%, putting it ahead of just 23.58% of US stocks in our set.
- If you're looking for stocks that are quantitatively similar to OPEN TEXT CORP, a group of peers worth examining would be HPE, HSTM, ZBRA, CPSI, and ACIW.
- Visit OTEX's SEC page to see the company's official filings. To visit the company's web site, go to www.opentext.com.
OTEX Valuation Summary
- In comparison to the median Technology stock, OTEX's price/earnings ratio is 138.13% higher, now standing at 61.2.
- Over the past 243 months, OTEX's price/sales ratio has gone down 0.7.
Below are key valuation metrics over time for OTEX.
Stock | Date | P/S | P/B | P/E | EV/EBIT |
---|---|---|---|---|---|
OTEX | 2023-01-31 | 2.6 | 2.4 | 61.2 | 28.3 |
OTEX | 2023-01-30 | 2.5 | 2.3 | 60.4 | 28.0 |
OTEX | 2023-01-27 | 2.6 | 2.4 | 61.9 | 28.6 |
OTEX | 2023-01-26 | 2.6 | 2.4 | 62.0 | 28.6 |
OTEX | 2023-01-25 | 2.5 | 2.3 | 60.2 | 28.0 |
OTEX | 2023-01-24 | 2.6 | 2.3 | 60.6 | 28.1 |
OTEX Growth Metrics
- Its year over year cash and equivalents growth rate is now at 10.71%.
- Its 3 year cash and equivalents growth rate is now at 113.49%.
- Its 2 year net income to common stockholders growth rate is now at 70.18%.

The table below shows OTEX's growth in key financial areas (numbers in millions of US dollars).
Date | Revenue | Operating Cash Flow | Net Income to Common Stock |
---|---|---|---|
2022-09-30 | 3,513.572 | 924.1 | 148.246 |
2022-06-30 | 3,493.844 | 981.81 | 397.09 |
2022-03-31 | 3,484.917 | 1,026.059 | 476.177 |
2021-12-31 | 3,435.565 | 766.074 | 492.986 |
2021-09-30 | 3,414.41 | 831.885 | 339.211 |
2021-06-30 | 3,386.115 | 876.12 | 310.672 |
OTEX's Quality Factors
The “Quality” component of the POWR Ratings focuses on 31 different factors of a companies fundamentals and operational strength. Here are some key insights as we drill into the specifics of these quality attributes.- OTEX has a Quality Grade of B, ranking ahead of 84.2% of graded US stocks.
- OTEX's asset turnover comes in at 0.355 -- ranking 71st of 83 Computers stocks.
- CLSK, NXGN, and INVE are the stocks whose asset turnover ratios are most correlated with OTEX.
The table below shows OTEX's key quality metrics over time.
Period | Asset Turnover | Gross Margin | ROIC |
---|---|---|---|
2021-09-30 | 0.355 | 0.694 | 0.180 |
2021-06-30 | 0.346 | 0.694 | 0.173 |
2021-03-31 | 0.334 | 0.692 | 0.146 |
2020-12-31 | 0.327 | 0.684 | 0.126 |
2020-09-30 | 0.321 | 0.682 | 0.118 |
2020-06-30 | 0.328 | 0.677 | 0.110 |
OTEX Price Target
For more insight on analysts targets of OTEX, see our OTEX price target page. And for a list of of all stocks sorted by upside potential based on analyst target price, see our Top Price Target page.
Average Price Target | $59.50 | Average Broker Recommendation | 1.5 (Moderate Buy) |
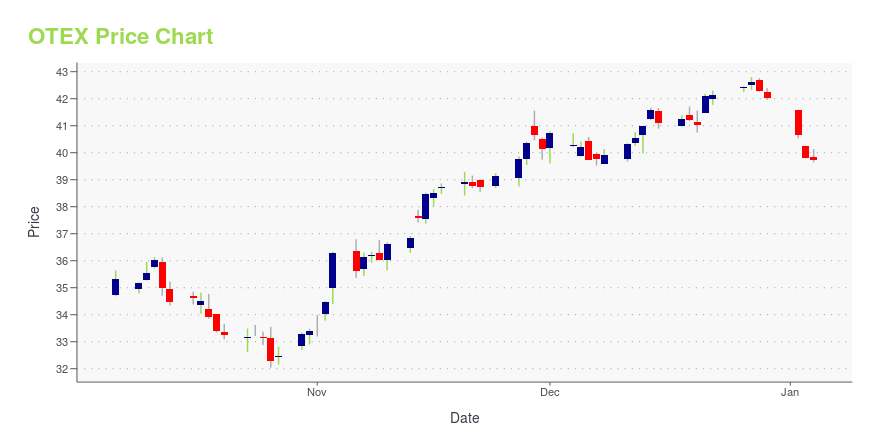
OTEX Stock Price Chart Interactive Chart >
OTEX Price/Volume Stats
Current price | $34.70 | 52-week high | $46.22 |
Prev. close | $33.26 | 52-week low | $24.91 |
Day low | $33.67 | Volume | 1,364,800 |
Day high | $35.23 | Avg. volume | 685,313 |
50-day MA | $30.58 | Dividend yield | 2.82% |
200-day MA | $33.70 | Market Cap | 9.38B |
Open Text Corporation (OTEX) Company Bio
Open Text Corporation provides a suite of software products and services that assist organizations in finding, utilizing, and sharing business information from various devices. The company was founded in 1991 and is based in Waterloo, Canada.
Latest OTEX News From Around the Web
Below are the latest news stories about OPEN TEXT CORP that investors may wish to consider to help them evaluate OTEX as an investment opportunity.
Open Text Corporation (OTEX) Q2 2023 Earnings Call TranscriptOpen Text Corporation (OTEX) Q2 2023 Earnings Conference Call February 02, 2023 05:00 PM ET Company Participants Harry Blount - Senior Vice President of Investor Relations Mark Barrenechea - Chief Executive Officer & Chief Technology Officer Madhu Ranganathan - Executive Vice President & Chief Financial Officer Conference Call Participants Paul Treiber - RBC Capital Markets Kevin Krishnaratne - Scotiabank Stephanie Price - CIBC Thanos Moschopoulos - BMO Capital Markets Richard Tse - National Bank Financial Daniel Chan - TD Securities Steven Li - Raymond James Presentation Operator Thank you for standing by. T... |
Open Text Corporation 2023 Q2 - Results - Earnings Call PresentationThe following slide deck was published by Open Text Corporation in conjunction with their 2023 Q2 earnings call. ... |
OpenText Reports Second Quarter Fiscal Year 2023 Financial ResultsOpen Text Corporation (NASDAQ: OTEX), (TSX: OTEX), today announced its financial results for the second quarter and year ended December 31, 2022. |
OpenText Buys Micro FocusOpenText™ (NASDAQ: OTEX), (TSX: OTEX) announced today that it has closed the previously announced acquisition (the "Acquisition") of Micro Focus International plc ("Micro Focus"), a leading provider of mission-critical software technology and services that help customers accelerate digital transformation. |
B2B Integration is the Backbone of a Digital-First, Resilient Supply ChainA new IDC White Paper, sponsored by OpenText™ (NASDAQ: OTEX), (TSX: OTEX), unveils that one of the biggest gaps in supply chain efficiency is the adoption of modern, digital technologies. As the study suggests, those companies more progressed in their business-to-business (B2B) digital transformation journey outperform those less progressed in revenue, profit, customer satisfaction, and responsiveness rate. |
OTEX Price Returns
1-mo | 15.40% |
3-mo | 31.61% |
6-mo | -9.38% |
1-year | -18.73% |
3-year | -20.15% |
5-year | 6.78% |
YTD | 17.07% |
2022 | -35.01% |
2021 | 5.37% |
2020 | 4.88% |
2019 | 37.48% |
2018 | -7.10% |
OTEX Dividends
Ex-Dividend Date | Type | Payout Amount | Change | ||||||
---|---|---|---|---|---|---|---|---|---|
Loading, please wait... |
Continue Researching OTEX
Want to do more research on Open Text Corp's stock and its price? Try the links below:Open Text Corp (OTEX) Stock Price | Nasdaq
Open Text Corp (OTEX) Stock Quote, History and News - Yahoo Finance
Open Text Corp (OTEX) Stock Price and Basic Information | MarketWatch
Loading social stream, please wait...