
Plains All American Pipeline L.P. (PAA): Price and Financial Metrics
PAA Price/Volume Stats
| Current price | $18.38 | 52-week high | $19.17 |
| Prev. close | $18.02 | 52-week low | $14.25 |
| Day low | $18.00 | Volume | 1,536,000 |
| Day high | $18.53 | Avg. volume | 2,906,260 |
| 50-day MA | $17.68 | Dividend yield | 6.69% |
| 200-day MA | $16.56 | Market Cap | 12.89B |
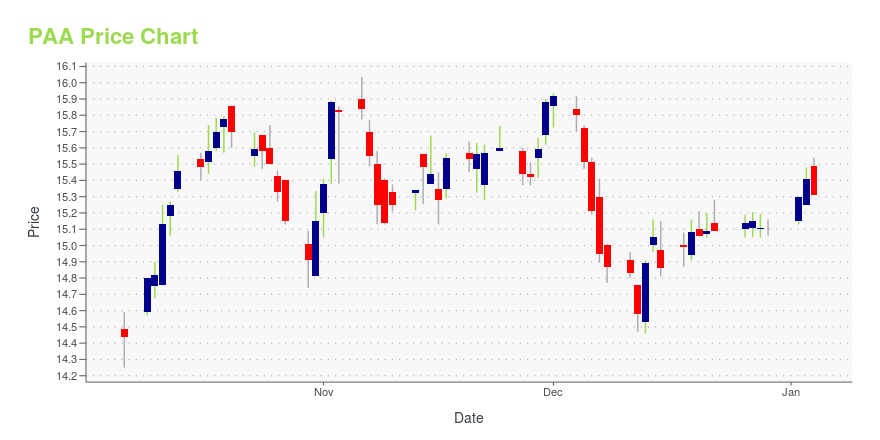
PAA Stock Price Chart Interactive Chart >
Plains All American Pipeline L.P. (PAA) Company Bio
Plains All American Pipeline L.P. is engaged in providing transportation, storage, processing, fractionation, and marketing services for crude oil, refined products, natural gas liquids, liquefied petroleum gas, and related products. As a mid-stream energy company, Plains All American Pipeline owns a net of pipeline transportation, terminalling, storage, and gathering assets in crude oil and NGL (Natural Gas Liquids) producing basins (including the Permian Basin) and transportation corridors and at major market hubs in the United State and Canada. Wille Chiang has served as Plains All American’s Chief Executive Officer since October of 2018 and as Chairman of the Board since January of 2020, overseeing a workforce of over 4,800 employees. Major customers for the company include Marathon Petroleum Corp. (MPC), ExxonMobil Corp. (XOM), and the Phillips 66 (PSX).
Latest PAA News From Around the Web
Below are the latest news stories about PLAINS ALL AMERICAN PIPELINE LP that investors may wish to consider to help them evaluate PAA as an investment opportunity.
Plains All American Pipeline (PAA) Ascends But Remains Behind Market: Some Facts to NoteIn the closing of the recent trading day, Plains All American Pipeline (PAA) stood at $15.15, denoting a +0.07% change from the preceding trading day. |
Plains All American Pipeline (PAA) Rises But Trails Market: What Investors Should KnowIn the latest trading session, Plains All American Pipeline (PAA) closed at $15.09, marking a +0.2% move from the previous day. |
20 Biggest Midstream Companies Heading into 2024In this article, we will take a look at the 20 biggest midstream companies heading into 2024. If you want to skip our detailed analysis, you can go directly to 5 Biggest Midstream Companies Heading into 2024. According to a report by Research and Markets, the oil and gas midstream market was valued at $27.5 billion […] |
Plains All American on Oil Demand LongevityOil demand has increased tremendously in the past few years, rebounding from COVID-era lows. Just three years ago, in the early months of the pandemic and lockdowns, oil demand declined alongside strengthening pressure for energy transition initiatives. During that time, there was a perception the world could quickly transition away from traditional fossil fuels. However, [...] |
The Plains All American Pipeline LP (PAA) Company: A Short SWOT AnalysisDecoding Plains All American Pipeline LP (PAA): A Strategic SWOT Insight |
PAA Price Returns
| 1-mo | 3.37% |
| 3-mo | 4.69% |
| 6-mo | 17.07% |
| 1-year | 32.85% |
| 3-year | 127.86% |
| 5-year | 10.85% |
| YTD | 25.96% |
| 2023 | 39.20% |
| 2022 | 35.81% |
| 2021 | 22.24% |
| 2020 | -50.79% |
| 2019 | -2.28% |
PAA Dividends
| Ex-Dividend Date | Type | Payout Amount | Change | ||||||
|---|---|---|---|---|---|---|---|---|---|
| Loading, please wait... | |||||||||
Continue Researching PAA
Want to do more research on Plains All American Pipeline Lp's stock and its price? Try the links below:Plains All American Pipeline Lp (PAA) Stock Price | Nasdaq
Plains All American Pipeline Lp (PAA) Stock Quote, History and News - Yahoo Finance
Plains All American Pipeline Lp (PAA) Stock Price and Basic Information | MarketWatch
Loading social stream, please wait...