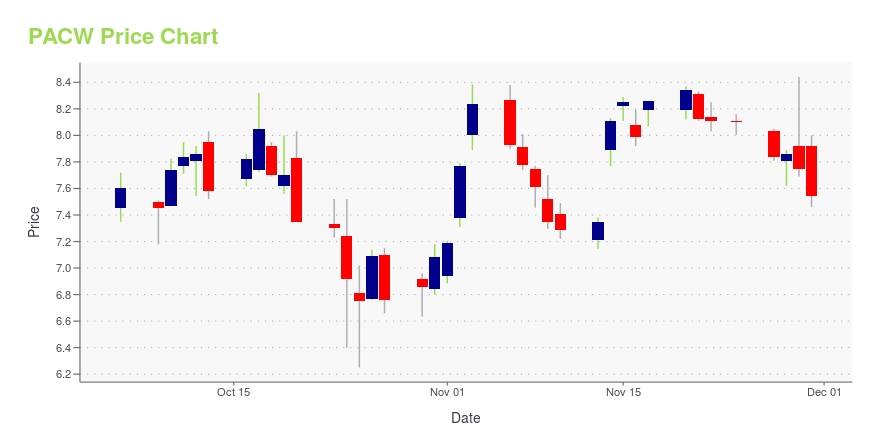
PacWest Bancorp (PACW): Price and Financial Metrics
PACW Price/Volume Stats
Current price | $7.91 | 52-week high | $30.07 |
Prev. close | $7.76 | 52-week low | $2.48 |
Day low | $7.79 | Volume | 2,774,000 |
Day high | $8.12 | Avg. volume | 14,750,868 |
50-day MA | $8.29 | Dividend yield | 0.52% |
200-day MA | $13.50 | Market Cap | 937.68M |
PACW Stock Price Chart Interactive Chart >
PACW POWR Grades
- PACW scores best on the Momentum dimension, with a Momentum rank ahead of 55.64% of US stocks.
- PACW's strongest trending metric is Value; it's been moving down over the last 120 days.
- PACW ranks lowest in Sentiment; there it ranks in the 0th percentile.
PACW Stock Summary
- PACW's one year PEG ratio, measuring expected growth in earnings next year relative to current common stock price is 0.26 -- higher than merely 3.54% of US-listed equities with positive expected earnings growth.
- In terms of volatility of its share price, PACW is more volatile than 95.12% of stocks we're observing.
- Shareholder yield, a measure of how much is returned to shareholders via dividends and share repurchases, for PACW comes in at -515.23% -- higher than that of just 1.22% of stocks in our set.
- Stocks with similar financial metrics, market capitalization, and price volatility to PACWEST BANCORP are TIPT, CAKE, PTEN, MTDR, and TEO.
- PACW's SEC filings can be seen here. And to visit PACWEST BANCORP's official web site, go to www.pacwestbancorp.com.
PACW Valuation Summary
- PACW's price/earnings ratio is -0.8; this is 108.42% lower than that of the median Financial Services stock.
- Over the past 243 months, PACW's price/sales ratio has gone down 3.9.
Below are key valuation metrics over time for PACW.
Stock | Date | P/S | P/B | P/E | EV/EBIT |
---|---|---|---|---|---|
PACW | 2023-09-15 | 1.0 | 0.4 | -0.8 | -1.2 |
PACW | 2023-09-14 | 1.0 | 0.4 | -0.8 | -1.2 |
PACW | 2023-09-13 | 0.9 | 0.4 | -0.8 | -1.2 |
PACW | 2023-09-12 | 0.9 | 0.4 | -0.8 | -1.2 |
PACW | 2023-09-11 | 0.9 | 0.4 | -0.8 | -1.2 |
PACW | 2023-09-08 | 0.9 | 0.4 | -0.7 | -1.1 |
PACW Growth Metrics
- The 2 year cash and equivalents growth rate now stands at 238.2%.
- Its 5 year net income to common stockholders growth rate is now at -416.44%.
- Its 4 year cash and equivalents growth rate is now at 106.5%.

The table below shows PACW's growth in key financial areas (numbers in millions of US dollars).
Date | Revenue | Operating Cash Flow | Net Income to Common Stock |
---|---|---|---|
2022-09-30 | 1,410.893 | 609.74 | 500.757 |
2022-06-30 | 1,387.28 | 543.92 | 518.529 |
2022-03-31 | 1,435.188 | 490.459 | 576.681 |
2021-12-31 | 1,459.751 | 502.956 | 606.959 |
2021-09-30 | 1,385.022 | 533.247 | 587.744 |
2021-06-30 | 1,230.411 | 440.456 | 493.251 |
PACW's Quality Factors
The “Quality” component of the POWR Ratings focuses on 31 different factors of a companies fundamentals and operational strength. Here are some key insights as we drill into the specifics of these quality attributes.- PACW has a Quality Grade of C, ranking ahead of 32.38% of graded US stocks.
- PACW's asset turnover comes in at 0.039 -- ranking 189th of 430 Banking stocks.
- WTFC, CATY, and USB are the stocks whose asset turnover ratios are most correlated with PACW.
The table below shows PACW's key quality metrics over time.
Period | Asset Turnover | Gross Margin | ROIC |
---|---|---|---|
2021-06-30 | 0.039 | 1 | 0.025 |
2021-03-31 | 0.034 | 1 | 0.018 |
2020-12-31 | 0.029 | 1 | -0.045 |
2020-09-30 | 0.030 | 1 | -0.046 |
2020-06-30 | 0.033 | 1 | -0.042 |
2020-03-31 | 0.039 | 1 | -0.036 |
PACW Price Target
For more insight on analysts targets of PACW, see our PACW price target page. And for a list of of all stocks sorted by upside potential based on analyst target price, see our Top Price Target page.
Average Price Target | $49.95 | Average Broker Recommendation | 1.4 (Strong Buy) |
PacWest Bancorp (PACW) Company Bio
PacWest Bancorp provides commercial banking products and services to individuals, professionals, and small to mid-sized businesses in the United States. The company was founded in 1999 and is based in Los Angeles, California.
Latest PACW News From Around the Web
Below are the latest news stories about PACWEST BANCORP that investors may wish to consider to help them evaluate PACW as an investment opportunity.
David Michery Wants You to Buy More Mullen (MULN) StockCEO David Michery has used every trick in the book to get shareholders to buy more MULN stock. |
Why PacWest Bancorp Stock Fell 14.6% in AugustPacWest Bancorp (NASDAQ: PACW) saw its stock price fall 14.6% in August, according to data provided by S&P Global Market Intelligence. The major market indexes were all down in August as the S&P 500 fell 1.6%, the Dow Jones Industrial Average dropped 2.4%, and the Nasdaq Composite plunged 1.7% last month. PacWest, based in Beverly Hills, California, is the 52nd-largest U.S. bank, with roughly $38.2 billion in assets as of June 30. |
A mini deposit run in early May preceded the sale of PacWestFollowing reports that the Los Angeles bank was considering strategic options, its deposits fell by $1.7 billion in two days, according to a securities filing. The disclosures shed new light on PacWest's predicament before its merger agreement with Banc of California. |
Is the Options Market Predicting a Spike in PacWest Bancorp (PACW) Stock?Investors need to pay close attention to PacWest Bancorp (PACW) stock based on the movements in the options market lately. |
Why PacWest Bancorp Stock Fell 10.3% This WeekPacWest Bancorp (NASDAQ: PACW) saw its stock price drop 10.3% this week as of Friday at 11:45 p.m. ET, according to data provided by S&P Global Market Intelligence. PacWest is now trading at about $7.80 per share, down almost 66% year to date. It was not a great week for the markets as the S&P 500 was down 2.4%, the Dow Jones Industrial Average dropped 2.2%, and the Nasdaq Composite fell 3%, as of Friday at 11:45 p.m. ET. |
PACW Price Returns
1-mo | -0.50% |
3-mo | -2.83% |
6-mo | -21.50% |
1-year | -64.25% |
3-year | -50.02% |
5-year | -79.68% |
YTD | -65.11% |
2022 | -47.61% |
2021 | 82.06% |
2020 | -29.99% |
2019 | 22.58% |
2018 | -30.79% |
PACW Dividends
Ex-Dividend Date | Type | Payout Amount | Change | ||||||
---|---|---|---|---|---|---|---|---|---|
Loading, please wait... |
Continue Researching PACW
Here are a few links from around the web to help you further your research on Pacwest Bancorp's stock as an investment opportunity:Pacwest Bancorp (PACW) Stock Price | Nasdaq
Pacwest Bancorp (PACW) Stock Quote, History and News - Yahoo Finance
Pacwest Bancorp (PACW) Stock Price and Basic Information | MarketWatch
Loading social stream, please wait...