
Plains Group Holdings, L.P. Class A Shares representing limited partner interests (PAGP): Price and Financial Metrics
PAGP Price/Volume Stats
| Current price | $19.37 | 52-week high | $20.10 |
| Prev. close | $18.99 | 52-week low | $14.71 |
| Day low | $19.00 | Volume | 1,643,712 |
| Day high | $19.47 | Avg. volume | 1,921,882 |
| 50-day MA | $18.62 | Dividend yield | 6.38% |
| 200-day MA | $17.30 | Market Cap | 3.82B |
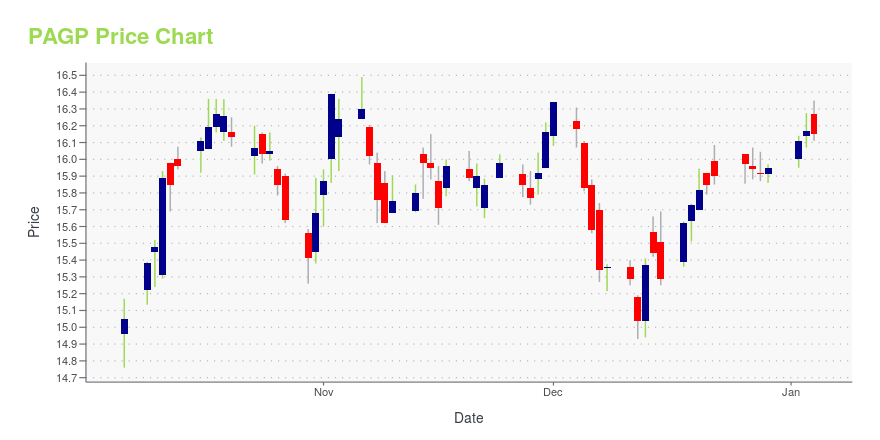
PAGP Stock Price Chart Interactive Chart >
Plains Group Holdings, L.P. Class A Shares representing limited partner interests (PAGP) Company Bio
Plains GP Holdings LP owns and operates midstream energy infrastructure and provides logistics services for crude oil, natural gas liquids, natural gas, and refined products in the United States and Canada. The company operates through three segments: Transportation, Facilities, and Supply and Logistics. The company was founded in 2013 and is based in Houston, Texas.
Latest PAGP News From Around the Web
Below are the latest news stories about PLAINS GP HOLDINGS LP that investors may wish to consider to help them evaluate PAGP as an investment opportunity.
Plains GP Holdings, L.P. (NASDAQ:PAGP) Q3 2023 Earnings Call TranscriptPlains GP Holdings, L.P. (NASDAQ:PAGP) Q3 2023 Earnings Call Transcript November 5, 2023 Operator: Good day and thank you for standing by. Welcome to Plains All America’s Third Quarter 2023 Earnings Conference Call. At this time, all participants are in a listen-only mode. After the speaker’s presentation, there will be a question-and-answer session. [Operator Instructions] […] |
Plains GP Holdings LP (PAGP) Reports Q3 2023 Earnings, Raises Full-Year GuidanceCompany announces capital allocation updates and Permian bolt-on acquisitions |
Plains All American Reports Third-Quarter 2023 Results & Raises 2023 GuidanceAnnounces Capital Allocation Updates & Permian Bolt-On AcquisitionsHOUSTON, Nov. 03, 2023 (GLOBE NEWSWIRE) -- Plains All American Pipeline, L.P. (Nasdaq: PAA) and Plains GP Holdings (Nasdaq: PAGP) today reported third-quarter 2023 results and provided updated 2023 guidance as highlighted below. Plains also provided additional information regarding its multi-year capital allocation framework and announced two bolt-on acquisitions in the Permian Basin. Third-Quarter Results Reported Net income att |
5 Low Price-to-Sales Stocks Poised to Deliver Robust ValueThe price-to-sales ratio is a convenient tool to gauge the value of stocks incurring losses or in an early development cycle. Stocks like GIII, JAKK, TITN, CRAI and PAGP hold promise. |
Plains All American Pipeline and Plains GP Holdings Announce Timing of Third-Quarter 2023 EarningsHOUSTON, Oct. 05, 2023 (GLOBE NEWSWIRE) -- Plains All American Pipeline, L.P. (Nasdaq: PAA) and Plains GP Holdings (Nasdaq: PAGP) announced they will release third-quarter 2023 earnings before market open on Friday, November 3, 2023 and will hold a joint webcast on the same day as follows: What: Third-quarter 2023 earnings webcast When: Friday, November 3, 2023 10:00 a.m. ET; 9:00 a.m. CT Where: www.plains.com or https://edge.media-server.com/mmc/p/m7siujui How: Live over the internet – log on a |
PAGP Price Returns
| 1-mo | 4.14% |
| 3-mo | 5.01% |
| 6-mo | 17.82% |
| 1-year | 31.68% |
| 3-year | 125.84% |
| 5-year | 15.48% |
| YTD | 25.87% |
| 2023 | 38.11% |
| 2022 | 31.80% |
| 2021 | 28.97% |
| 2020 | -51.17% |
| 2019 | 0.30% |
PAGP Dividends
| Ex-Dividend Date | Type | Payout Amount | Change | ||||||
|---|---|---|---|---|---|---|---|---|---|
| Loading, please wait... | |||||||||
Continue Researching PAGP
Want to see what other sources are saying about Plains Gp Holdings Lp's financials and stock price? Try the links below:Plains Gp Holdings Lp (PAGP) Stock Price | Nasdaq
Plains Gp Holdings Lp (PAGP) Stock Quote, History and News - Yahoo Finance
Plains Gp Holdings Lp (PAGP) Stock Price and Basic Information | MarketWatch
Loading social stream, please wait...