Pangaea Logistics Solutions Ltd. (PANL): Price and Financial Metrics
GET POWR RATINGS... FREE!
PANL POWR Grades
- Value is the dimension where PANL ranks best; there it ranks ahead of 93.23% of US stocks.
- PANL's strongest trending metric is Stability; it's been moving up over the last 177 days.
- PANL ranks lowest in Quality; there it ranks in the 48th percentile.
PANL Stock Summary
- With a price/earnings ratio of 3.33, PANGAEA LOGISTICS SOLUTIONS LTD P/E ratio is greater than that of about only 4.86% of stocks in our set with positive earnings.
- The price/operating cash flow metric for PANGAEA LOGISTICS SOLUTIONS LTD is higher than just 7.76% of stocks in our set with a positive cash flow.
- With a price/sales ratio of 0.33, PANGAEA LOGISTICS SOLUTIONS LTD has a higher such ratio than just 9.48% of stocks in our set.
- If you're looking for stocks that are quantitatively similar to PANGAEA LOGISTICS SOLUTIONS LTD, a group of peers worth examining would be SMHI, ESEA, ASC, LPG, and SXC.
- Visit PANL's SEC page to see the company's official filings. To visit the company's web site, go to www.pangaeals.com.
PANL Valuation Summary
- In comparison to the median Industrials stock, PANL's EV/EBIT ratio is 72.01% lower, now standing at 4.8.
- Over the past 111 months, PANL's EV/EBIT ratio has gone NA NA.
Below are key valuation metrics over time for PANL.
Stock | Date | P/S | P/B | P/E | EV/EBIT |
---|---|---|---|---|---|
PANL | 2023-01-24 | 0.3 | 0.9 | 3.4 | 4.8 |
PANL | 2023-01-23 | 0.3 | 0.9 | 3.4 | 4.8 |
PANL | 2023-01-20 | 0.3 | 0.9 | 3.5 | 4.8 |
PANL | 2023-01-19 | 0.3 | 0.9 | 3.3 | 4.8 |
PANL | 2023-01-18 | 0.3 | 0.9 | 3.3 | 4.7 |
PANL | 2023-01-17 | 0.3 | 0.9 | 3.4 | 4.8 |
PANL Growth Metrics
- The year over year net income to common stockholders growth rate now stands at 239.73%.
- Its 5 year cash and equivalents growth rate is now at 52.66%.
- Its 3 year cash and equivalents growth rate is now at 13.47%.

The table below shows PANL's growth in key financial areas (numbers in millions of US dollars).
Date | Revenue | Operating Cash Flow | Net Income to Common Stock |
---|---|---|---|
2022-09-30 | 806.3418 | 120.9363 | 79.13897 |
2022-06-30 | 834.8939 | 111.4365 | 87.34579 |
2022-03-31 | 784.8943 | 88.86716 | 81.54063 |
2021-12-31 | 718.1044 | 61.74531 | 67.22683 |
2021-09-30 | 596.3995 | 41.07145 | 59.66681 |
2021-06-30 | 487.1368 | 33.4623 | 40.22382 |
PANL's Quality Factors
The “Quality” component of the POWR Ratings focuses on 31 different factors of a companies fundamentals and operational strength. Here are some key insights as we drill into the specifics of these quality attributes.- PANL has a Quality Grade of D, ranking ahead of 8.46% of graded US stocks.
- PANL's asset turnover comes in at 1.015 -- ranking 34th of 137 Transportation stocks.
- RLGT, OMEX, and BKEP are the stocks whose asset turnover ratios are most correlated with PANL.
The table below shows PANL's key quality metrics over time.
Period | Asset Turnover | Gross Margin | ROIC |
---|---|---|---|
2021-06-30 | 1.015 | 0.159 | 0.093 |
2021-03-31 | 0.924 | 0.156 | 0.067 |
2020-12-31 | 0.858 | 0.144 | 0.040 |
2020-09-30 | 0.883 | 0.142 | 0.016 |
2020-06-30 | 0.896 | 0.142 | 0.018 |
2020-03-31 | 0.914 | 0.144 | 0.020 |
PANL Price Target
For more insight on analysts targets of PANL, see our PANL price target page. And for a list of of all stocks sorted by upside potential based on analyst target price, see our Top Price Target page.
Average Price Target | $5.35 | Average Broker Recommendation | 1.67 (Moderate Buy) |
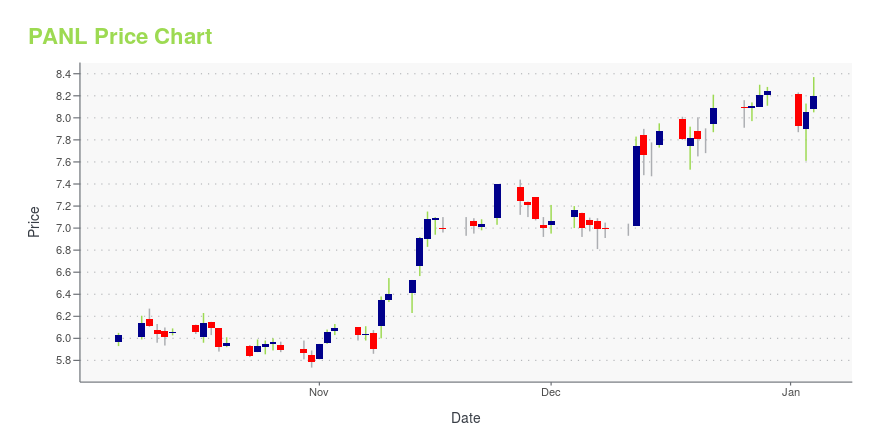
PANL Stock Price Chart Interactive Chart >
PANL Price/Volume Stats
Current price | $5.73 | 52-week high | $7.05 |
Prev. close | $5.84 | 52-week low | $3.81 |
Day low | $5.62 | Volume | 234,300 |
Day high | $5.92 | Avg. volume | 177,376 |
50-day MA | $5.23 | Dividend yield | 6.98% |
200-day MA | $5.15 | Market Cap | 263.14M |
Pangaea Logistics Solutions Ltd. (PANL) Company Bio
Pangaea Logistics Solutions Ltd. provides seaborne dry bulk transportation services to industrial customers worldwide. Its dry bulk cargoes include grains, pig iron, hot briquetted iron, bauxite, alumina, cement clinker, dolomite, and limestone. The company also provides cargo loading, cargo discharge, vessel chartering, voyage planning, and technical vessel management services. The company was founded in 1996 and is based in Newport, Rhode Island.
Latest PANL News From Around the Web
Below are the latest news stories about PANGAEA LOGISTICS SOLUTIONS LTD that investors may wish to consider to help them evaluate PANL as an investment opportunity.
Are Robust Financials Driving The Recent Rally In Pangaea Logistics Solutions, Ltd.'s (NASDAQ:PANL) Stock?Most readers would already be aware that Pangaea Logistics Solutions' (NASDAQ:PANL) stock increased significantly by... |
Pangaea Logistics Solutions Ltd. (NASDAQ:PANL) Slides -0.39 Percent In Recent Trade, What Can We Expect Next?Pangaea Logistics Solutions Ltd. (NASDAQ:PANL) traded at $5.15 at close of the session on Friday, 12/30/22, made a downward move of -0.39% on its previous day’s price. Looking at the stock we see that its previous close was $5.17 and the beta (5Y monthly) reads 0.69 with the day’s price range being $5.04 – $5.21. … Pangaea Logistics Solutions Ltd. (NASDAQ:PANL) Slides -0.39 Percent In Recent Trade, What Can We Expect Next? Read More » |
Pangaea Logistics Solutions (NASDAQ:PANL) shareholders have earned a 23% CAGR over the last three yearsBy buying an index fund, investors can approximate the average market return. But if you choose individual stocks with... |
Sidoti's December Small-Cap Virtual ConferenceSidoti & Company, LLC has released the presentation schedule and weblinks for its two-day December Small-Cap Conference taking place Wednesday and Thursday, December 7-8, 2022. |
Pangaea Logistics Solutions' (NASDAQ:PANL) Dividend Will Be Increased To $0.10Pangaea Logistics Solutions, Ltd.'s ( NASDAQ:PANL ) dividend will be increasing from last year's payment of the same... |
PANL Price Returns
1-mo | 13.24% |
3-mo | 20.23% |
6-mo | 16.77% |
1-year | 56.69% |
3-year | 106.59% |
5-year | 158.29% |
YTD | 11.26% |
2022 | 44.19% |
2021 | 40.77% |
2020 | -6.10% |
2019 | 0.50% |
2018 | -17.66% |
PANL Dividends
Ex-Dividend Date | Type | Payout Amount | Change | ||||||
---|---|---|---|---|---|---|---|---|---|
Loading, please wait... |
Continue Researching PANL
Here are a few links from around the web to help you further your research on Pangaea Logistics Solutions Ltd's stock as an investment opportunity:Pangaea Logistics Solutions Ltd (PANL) Stock Price | Nasdaq
Pangaea Logistics Solutions Ltd (PANL) Stock Quote, History and News - Yahoo Finance
Pangaea Logistics Solutions Ltd (PANL) Stock Price and Basic Information | MarketWatch
Loading social stream, please wait...