Patrick Industries, Inc. (PATK): Price and Financial Metrics
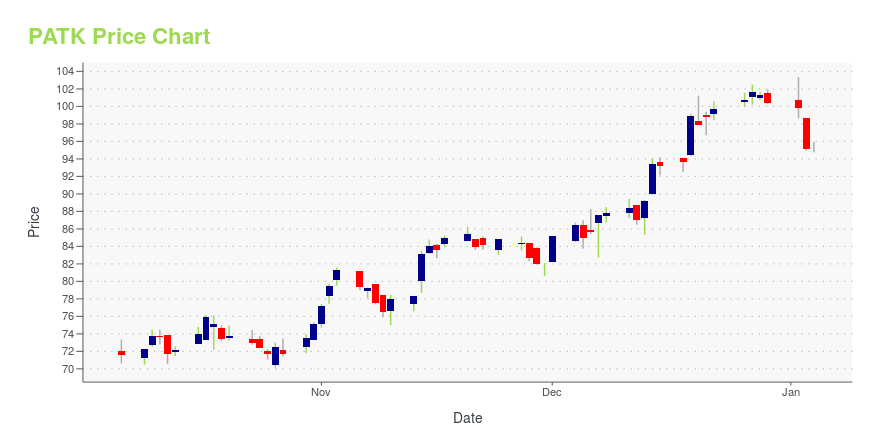
PATK Price/Volume Stats
Current price | $74.94 | 52-week high | $87.36 |
Prev. close | $76.33 | 52-week low | $41.75 |
Day low | $74.61 | Volume | 80,268 |
Day high | $76.00 | Avg. volume | 143,420 |
50-day MA | $81.47 | Dividend yield | 2.34% |
200-day MA | $72.67 | Market Cap | 1.66B |
PATK Stock Price Chart Interactive Chart >
PATK POWR Grades
- Value is the dimension where PATK ranks best; there it ranks ahead of 85.48% of US stocks.
- The strongest trend for PATK is in Value, which has been heading down over the past 177 days.
- PATK ranks lowest in Sentiment; there it ranks in the 15th percentile.
PATK Stock Summary
- Price to trailing twelve month operating cash flow for PATK is currently 3.27, higher than only 12.61% of US stocks with positive operating cash flow.
- As for revenue growth, note that PATK's revenue has grown -22.7% over the past 12 months; that beats the revenue growth of merely 11.38% of US companies in our set.
- Shareholder yield, a measure of how much is returned to shareholders via dividends and share repurchases, for PATK comes in at 20.73% -- higher than that of 91.25% of stocks in our set.
- Stocks with similar financial metrics, market capitalization, and price volatility to PATRICK INDUSTRIES INC are THO, VIA, ABM, TKR, and THRY.
- Visit PATK's SEC page to see the company's official filings. To visit the company's web site, go to www.patrickind.com.
PATK Valuation Summary
- In comparison to the median Consumer Cyclical stock, PATK's price/sales ratio is 78.95% lower, now standing at 0.4.
- Over the past 243 months, PATK's price/earnings ratio has gone up 9.5.
Below are key valuation metrics over time for PATK.
Stock | Date | P/S | P/B | P/E | EV/EBIT |
---|---|---|---|---|---|
PATK | 2023-09-13 | 0.4 | 1.7 | 10.1 | 10.6 |
PATK | 2023-09-12 | 0.4 | 1.7 | 10.1 | 10.6 |
PATK | 2023-09-11 | 0.4 | 1.7 | 10.0 | 10.5 |
PATK | 2023-09-08 | 0.4 | 1.7 | 10.0 | 10.6 |
PATK | 2023-09-07 | 0.4 | 1.7 | 10.1 | 10.6 |
PATK | 2023-09-06 | 0.5 | 1.8 | 10.3 | 10.7 |
PATK Growth Metrics
- Its 2 year cash and equivalents growth rate is now at -32.45%.
- The 2 year price growth rate now stands at 66.01%.
- The 4 year cash and equivalents growth rate now stands at 765.67%.

The table below shows PATK's growth in key financial areas (numbers in millions of US dollars).
Date | Revenue | Operating Cash Flow | Net Income to Common Stock |
---|---|---|---|
2022-09-30 | 5,077.436 | 334.521 | 349.036 |
2022-06-30 | 5,025.524 | 247.681 | 347.614 |
2022-03-31 | 4,569.784 | 178.799 | 290.075 |
2021-12-31 | 4,078.092 | 252.13 | 224.915 |
2021-09-30 | 3,703.226 | 194.812 | 201.719 |
2021-06-30 | 3,343.756 | 199.526 | 181.658 |
PATK's Quality Factors
The “Quality” component of the POWR Ratings focuses on 31 different factors of a companies fundamentals and operational strength. Here are some key insights as we drill into the specifics of these quality attributes.- PATK has a Quality Grade of C, ranking ahead of 39.16% of graded US stocks.
- PATK's asset turnover comes in at 1.81 -- ranking 4th of 60 Construction Materials stocks.
- DOOR, TREX, and GIFI are the stocks whose asset turnover ratios are most correlated with PATK.
The table below shows PATK's key quality metrics over time.
Period | Asset Turnover | Gross Margin | ROIC |
---|---|---|---|
2021-06-27 | 1.810 | 0.192 | 0.176 |
2021-03-28 | 1.651 | 0.186 | 0.141 |
2020-12-31 | 1.568 | 0.185 | 0.128 |
2020-09-27 | 1.494 | 0.184 | 0.116 |
2020-06-28 | 1.434 | 0.182 | 0.099 |
2020-03-29 | 1.606 | 0.184 | 0.130 |
PATK Price Target
For more insight on analysts targets of PATK, see our PATK price target page. And for a list of of all stocks sorted by upside potential based on analyst target price, see our Top Price Target page.
Average Price Target | $113.25 | Average Broker Recommendation | 1.38 (Strong Buy) |
Patrick Industries, Inc. (PATK) Company Bio
Patrick Industries is a manufacturer of component products and distributor of building products serving the recreational vehicle, manufactured housing, kitchen cabinet, office and household furniture, fixtures and commercial furnishings, marine, and other industrial markets. The company was founded in 1959 and is based in Elkhart, Indiana.
Latest PATK News From Around the Web
Below are the latest news stories about PATRICK INDUSTRIES INC that investors may wish to consider to help them evaluate PATK as an investment opportunity.
At US$75.88, Is It Time To Put Patrick Industries, Inc. (NASDAQ:PATK) On Your Watch List?Patrick Industries, Inc. ( NASDAQ:PATK ), might not be a large cap stock, but it saw significant share price movement... |
ROCKFORD FOSGATE UNVEILS ALL-IN-ONE OVERHEAD AUDIO SYSTEM FOR CAN-AM DEFENDER MODELSRockford Fosgate, the industry leader in high-performance audio, released its latest all-in-one solution with its Can-Am Defender Stage-1 audio system. Purpose built for any environment, this plug-and-play system ensures a simple, easy to install, full audio experience. |
ROCKFORD FOSGATE LITERALLY ELEVATES AUDIO FOR POLARIS RANGER WITH THE ALL-NEW, ALL-IN-ONE ROOF SYSTEMRockford Fosgate, the industry leader in high-performance audio, announced the launch of its latest innovation, the Ranger Roof Audio System. Purpose built for the outdoor environment, this all-in-one audio system redefines the ultimate outdoor audio experiences, blending exceptional performance with seamless installation. |
Should You Be Excited About Patrick Industries, Inc.'s (NASDAQ:PATK) 17% Return On Equity?Many investors are still learning about the various metrics that can be useful when analysing a stock. This article is... |
Patrick Industries, Inc. (NASDAQ:PATK) Looks Interesting, And It's About To Pay A DividendReaders hoping to buy Patrick Industries, Inc. ( NASDAQ:PATK ) for its dividend will need to make their move shortly... |
PATK Price Returns
1-mo | -6.18% |
3-mo | -4.59% |
6-mo | 13.56% |
1-year | 76.75% |
3-year | 46.28% |
5-year | 36.01% |
YTD | 25.84% |
2022 | -23.07% |
2021 | 19.72% |
2020 | 32.77% |
2019 | 77.91% |
2018 | -57.36% |
PATK Dividends
Ex-Dividend Date | Type | Payout Amount | Change | ||||||
---|---|---|---|---|---|---|---|---|---|
Loading, please wait... |
Continue Researching PATK
Want to see what other sources are saying about Patrick Industries Inc's financials and stock price? Try the links below:Patrick Industries Inc (PATK) Stock Price | Nasdaq
Patrick Industries Inc (PATK) Stock Quote, History and News - Yahoo Finance
Patrick Industries Inc (PATK) Stock Price and Basic Information | MarketWatch
Loading social stream, please wait...