Paycom Software, Inc. (PAYC): Price and Financial Metrics
GET POWR RATINGS... FREE!
PAYC POWR Grades
- PAYC scores best on the Quality dimension, with a Quality rank ahead of 90.86% of US stocks.
- PAYC's strongest trending metric is Value; it's been moving up over the last 179 days.
- PAYC ranks lowest in Value; there it ranks in the 19th percentile.
PAYC Stock Summary
- With a price/earnings ratio of 110.53, Paycom Software Inc P/E ratio is greater than that of about 94.28% of stocks in our set with positive earnings.
- Price to trailing twelve month operating cash flow for PAYC is currently 67.82, higher than 92.66% of US stocks with positive operating cash flow.
- PAYC's price/sales ratio is 20.52; that's higher than the P/S ratio of 93.16% of US stocks.
- Stocks that are quantitatively similar to PAYC, based on their financial statements, market capitalization, and price volatility, are EXAS, AKAM, PHR, ONTF, and LMND.
- Visit PAYC's SEC page to see the company's official filings. To visit the company's web site, go to www.paycom.com.
PAYC Valuation Summary
- PAYC's EV/EBIT ratio is 137.8; this is 327.29% higher than that of the median Technology stock.
- Over the past 90 months, PAYC's price/earnings ratio has gone down 445.9.
- PAYC's price/sales ratio has moved up 24.5 over the prior 90 months.
Below are key valuation metrics over time for PAYC.
Stock | Date | P/S | P/B | P/E | EV/EBIT |
---|---|---|---|---|---|
PAYC | 2021-09-01 | 31.7 | 37.3 | 175.2 | 137.8 |
PAYC | 2021-08-31 | 31.5 | 37.1 | 174.1 | 136.9 |
PAYC | 2021-08-30 | 31.5 | 37.1 | 174.1 | 136.9 |
PAYC | 2021-08-27 | 31.3 | 36.8 | 172.6 | 135.8 |
PAYC | 2021-08-26 | 31.0 | 36.5 | 171.4 | 134.8 |
PAYC | 2021-08-25 | 31.2 | 36.7 | 172.4 | 135.6 |
PAYC Growth Metrics
- The 2 year revenue growth rate now stands at 66.88%.
- Its 2 year cash and equivalents growth rate is now at 166.92%.
- Its 4 year net cashflow from operations growth rate is now at 277.81%.

The table below shows PAYC's growth in key financial areas (numbers in millions of US dollars).
Date | Revenue | Operating Cash Flow | Net Income to Common Stock |
---|---|---|---|
2021-12-31 | 1,055.524 | 319.362 | 195.96 |
2021-09-30 | 991.485 | 282.516 | 171.64 |
2021-06-30 | 931.823 | 266.138 | 168.743 |
2021-03-31 | 871.264 | 234.634 | 145.054 |
2020-12-31 | 841.434 | 227.207 | 143.453 |
2020-09-30 | 813.896 | 222.172 | 164.466 |
PAYC's Quality Factors
The “Quality” component of the POWR Ratings focuses on 31 different factors of a companies fundamentals and operational strength. Here are some key insights as we drill into the specifics of these quality attributes.- PAYC has a Quality Grade of B, ranking ahead of 91.45% of graded US stocks.
- PAYC's asset turnover comes in at 0.318 -- ranking 425th of 561 Business Services stocks.
- EEX, GOOGL, and PRAA are the stocks whose asset turnover ratios are most correlated with PAYC.
The table below shows PAYC's key quality metrics over time.
Period | Asset Turnover | Gross Margin | ROIC |
---|---|---|---|
2021-06-30 | 0.318 | 0.853 | 0.290 |
2021-03-31 | 0.334 | 0.851 | 0.274 |
2020-12-31 | 0.361 | 0.853 | 0.278 |
2020-09-30 | 0.354 | 0.853 | 0.331 |
2020-06-30 | 0.381 | 0.855 | 0.377 |
2020-03-31 | 0.380 | 0.858 | 0.450 |
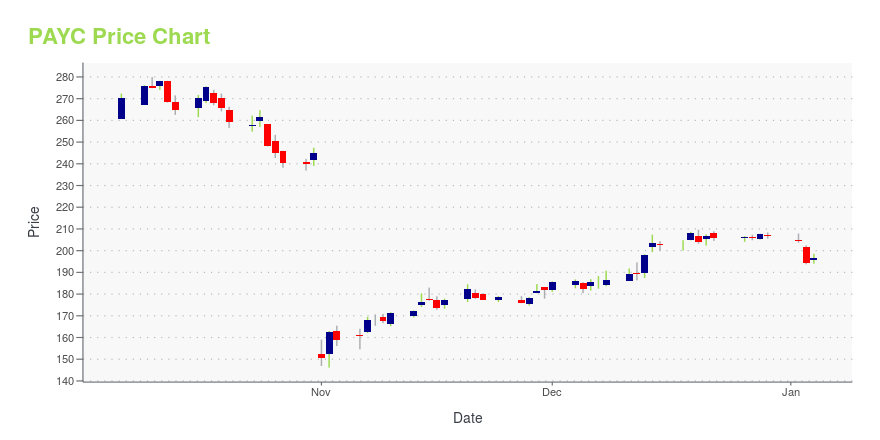
PAYC Stock Price Chart Interactive Chart >
PAYC Price/Volume Stats
Current price | $274.38 | 52-week high | $558.97 |
Prev. close | $276.79 | 52-week low | $259.95 |
Day low | $266.06 | Volume | 362,800 |
Day high | $279.41 | Avg. volume | 536,222 |
50-day MA | $312.89 | Dividend yield | N/A |
200-day MA | $401.35 | Market Cap | 16.53B |
Paycom Software, Inc. (PAYC) Company Bio
Paycom Software offers cloud-based human capital management software solutions delivered as Softwareas-a-Service in the United States. It provides functionality and data analytics that businesses need to manage the complete employment life-cycle from recruitment to retirement. The company was founded in 1998 and is based in Oklahoma City, Oklahoma.
Latest PAYC News From Around the Web
Below are the latest news stories about Paycom Software Inc that investors may wish to consider to help them evaluate PAYC as an investment opportunity.
Tech Sell-Off: 2 Bargain Growth Stocks to Buy Before the ReboundTech stocks have been hammered recently, especially those trading at rich valuations. It's expected the Federal Reserve will raise interest rates 3 to 7 times this year to combat rampant inflation, setting in motion a chain of events that should ultimately slow inflation by reducing business and consumer spending. Of course, less spending also means slower corporate revenue growth, which means those richly valued stocks now look even more expensive. |
This Fintech Stock Is Overshadowed by CompetitorsIn this clip from "The Rank" on Motley Fool Live, recorded on Feb. 7, Motley Fool contributors Matt Frankel and Jason Hall discuss Ceridian's (NYSE: CDAY) financials and analyze whether it's worth investing in given the fiercely competitive fintech industry. Matt Frankel: No. 8 is a stock called Ceridian. |
Some Investors May Be Worried About Paycom Software's (NYSE:PAYC) Returns On CapitalWhat trends should we look for it we want to identify stocks that can multiply in value over the long term? Typically... |
DA Davidson Equities Analysts Decrease Earnings Estimates for Paycom Software, Inc. (NYSE:PAYC)Paycom Software, Inc. (NYSE:PAYC) – Equities research analysts at DA Davidson lowered their FY2022 earnings per share (EPS) estimates for shares of Paycom Software in a research note issued to … Read Full Story at source (may require registration) The post DA Davidson Equities Analysts Decrease Earnings Estimates for Paycom Software, Inc. (NYSE:PAYC) appeared first on ForexTV . |
This Disruptive Company Has Explosive Growth PotentialPaycom Software (NYSE: PAYC) has been at the forefront of disrupting the payroll sector since CEO Chad Richison founded the company in 1998. The company's latest innovation, Beti, is once again disrupting the industry by changing the entire payroll procedure. It's helping drive explosive growth for Paycom, which could continue for years to come. |
PAYC Price Returns
1-mo | -7.29% |
3-mo | -12.86% |
6-mo | N/A |
1-year | -18.45% |
3-year | 31.77% |
5-year | 316.29% |
YTD | -33.91% |
2021 | -8.19% |
2020 | 70.82% |
2019 | 116.22% |
2018 | 52.43% |
2017 | 76.59% |
Continue Researching PAYC
Want to see what other sources are saying about Paycom Software Inc's financials and stock price? Try the links below:Paycom Software Inc (PAYC) Stock Price | Nasdaq
Paycom Software Inc (PAYC) Stock Quote, History and News - Yahoo Finance
Paycom Software Inc (PAYC) Stock Price and Basic Information | MarketWatch
Loading social stream, please wait...