Paccar Inc. (PCAR): Price and Financial Metrics
PCAR Price/Volume Stats
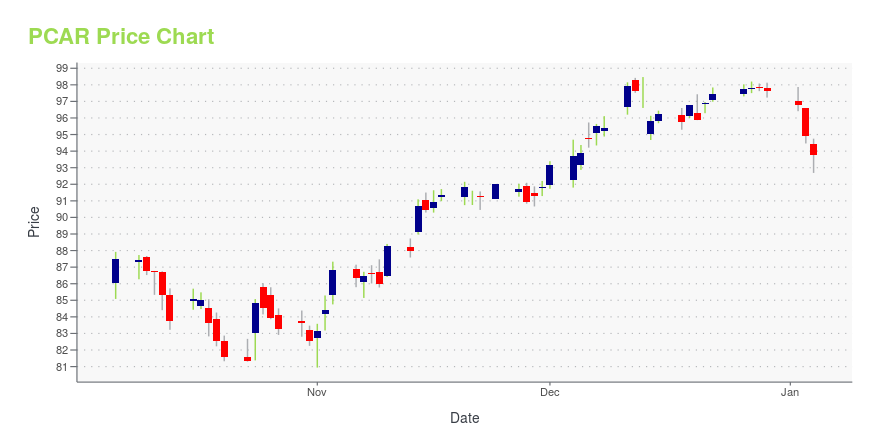
Current price | $123.89 | 52-week high | $125.50 |
Prev. close | $124.46 | 52-week low | $67.48 |
Day low | $123.55 | Volume | 2,280,800 |
Day high | $125.50 | Avg. volume | 2,323,057 |
50-day MA | $110.27 | Dividend yield | 0.88% |
200-day MA | $93.03 | Market Cap | 64.92B |
PCAR Stock Price Chart Interactive Chart >
PCAR POWR Grades
- PCAR scores best on the Quality dimension, with a Quality rank ahead of 79.1% of US stocks.
- The strongest trend for PCAR is in Growth, which has been heading down over the past 26 weeks.
- PCAR's current lowest rank is in the Value metric (where it is better than 40.36% of US stocks).
PCAR Stock Summary
- With a market capitalization of $49,655,589,681, PACCAR INC has a greater market value than 94.96% of US stocks.
- PACCAR INC's stock had its IPO on July 9, 1986, making it an older stock than 92.45% of US equities in our set.
- The ratio of debt to operating expenses for PACCAR INC is higher than it is for about 88.31% of US stocks.
- Stocks with similar financial metrics, market capitalization, and price volatility to PACCAR INC are OXY, DD, CNHI, TEL, and CTVA.
- PCAR's SEC filings can be seen here. And to visit PACCAR INC's official web site, go to www.paccar.com.
PCAR Valuation Summary
- PCAR's price/sales ratio is 1.5; this is 25% higher than that of the median Industrials stock.
- Over the past 243 months, PCAR's EV/EBIT ratio has gone down 2.5.
Below are key valuation metrics over time for PCAR.
Stock | Date | P/S | P/B | P/E | EV/EBIT |
---|---|---|---|---|---|
PCAR | 2023-12-29 | 1.5 | 3.2 | 12.4 | 10.2 |
PCAR | 2023-12-28 | 1.5 | 3.2 | 12.5 | 10.3 |
PCAR | 2023-12-27 | 1.5 | 3.2 | 12.5 | 10.3 |
PCAR | 2023-12-26 | 1.5 | 3.2 | 12.5 | 10.2 |
PCAR | 2023-12-22 | 1.5 | 3.2 | 12.4 | 10.2 |
PCAR | 2023-12-21 | 1.5 | 3.2 | 12.3 | 10.2 |
PCAR Growth Metrics
- Its 2 year price growth rate is now at 24.44%.
- The 2 year cash and equivalents growth rate now stands at -0.25%.
- The 5 year revenue growth rate now stands at 43.03%.
The table below shows PCAR's growth in key financial areas (numbers in millions of US dollars).
Date | Revenue | Operating Cash Flow | Net Income to Common Stock |
---|---|---|---|
2022-12-31 | 28,819.7 | 3,027 | 3,011.6 |
2022-09-30 | 27,376.3 | 2,814.7 | 2,601.7 |
2022-06-30 | 25,464.2 | 2,416.5 | 2,210 |
2022-03-31 | 24,149.4 | 2,109.1 | 1,982.5 |
2021-12-31 | 23,522.3 | 2,186.7 | 1,852.1 |
2021-09-30 | 22,404.8 | 1,944.9 | 1,746.5 |
PCAR's Quality Factors
The “Quality” component of the POWR Ratings focuses on 31 different factors of a companies fundamentals and operational strength. Here are some key insights as we drill into the specifics of these quality attributes.- PCAR has a Quality Grade of C, ranking ahead of 40.96% of graded US stocks.
- PCAR's asset turnover comes in at 0.788 -- ranking 42nd of 68 Automobiles and Trucks stocks.
- ALSN, ALV, and F are the stocks whose asset turnover ratios are most correlated with PCAR.
The table below shows PCAR's key quality metrics over time.
Period | Asset Turnover | Gross Margin | ROIC |
---|---|---|---|
2021-09-30 | 0.788 | 0.196 | 0.075 |
2021-06-30 | 0.786 | 0.198 | 0.076 |
2021-03-31 | 0.703 | 0.198 | 0.063 |
2020-12-31 | 0.686 | 0.195 | 0.059 |
2020-09-30 | 0.706 | 0.197 | 0.065 |
2020-06-30 | 0.754 | 0.197 | 0.074 |
PCAR Price Target
For more insight on analysts targets of PCAR, see our PCAR price target page. And for a list of of all stocks sorted by upside potential based on analyst target price, see our Top Price Target page.
Average Price Target | $97.29 | Average Broker Recommendation | 1.68 (Moderate Buy) |
Paccar Inc. (PCAR) Company Bio
PACCAR Inc is an American Fortune 500 company and counts among the largest manufacturers of medium- and heavy-duty trucks in the world. PACCAR is engaged in the design, manufacture and customer support of light-, medium- and heavy-duty trucks under the Kenworth, Peterbilt, Leyland Trucks, and DAF nameplates. PACCAR also designs and manufactures powertrains, provides financial services and information technology, and distributes truck parts related to its principal business. (Source:Wikipedia)
Latest PCAR News From Around the Web
Below are the latest news stories about PACCAR INC that investors may wish to consider to help them evaluate PCAR as an investment opportunity.
These 2 Auto-Tires-Trucks Stocks Could Beat Earnings: Why They Should Be on Your RadarWhy investors should use the Zacks Earnings ESP tool to help find stocks that are poised to top quarterly earnings estimates. |
Paccar (PCAR) Rises Higher Than Market: Key FactsIn the most recent trading session, Paccar (PCAR) closed at $97.47, indicating a +0.59% shift from the previous trading day. |
3 Reasons Why Growth Investors Shouldn't Overlook Paccar (PCAR)Paccar (PCAR) possesses solid growth attributes, which could help it handily outperform the market. |
PCAR vs. TSLA: Which Stock Is the Better Value Option?PCAR vs. TSLA: Which Stock Is the Better Value Option? |
Are Auto-Tires-Trucks Stocks Lagging PACCAR (PCAR) This Year?Here is how Paccar (PCAR) and Ferrari (RACE) have performed compared to their sector so far this year. |
PCAR Price Returns
1-mo | 11.24% |
3-mo | 27.20% |
6-mo | 51.49% |
1-year | 79.55% |
3-year | 124.54% |
5-year | 229.56% |
YTD | 27.20% |
2023 | 55.01% |
2022 | 17.00% |
2021 | 5.63% |
2020 | 11.74% |
2019 | 45.05% |
PCAR Dividends
Ex-Dividend Date | Type | Payout Amount | Change | ||||||
---|---|---|---|---|---|---|---|---|---|
Loading, please wait... |
Continue Researching PCAR
Here are a few links from around the web to help you further your research on Paccar Inc's stock as an investment opportunity:Paccar Inc (PCAR) Stock Price | Nasdaq
Paccar Inc (PCAR) Stock Quote, History and News - Yahoo Finance
Paccar Inc (PCAR) Stock Price and Basic Information | MarketWatch
Loading social stream, please wait...