Paccar Inc. (PCAR): Price and Financial Metrics
GET POWR RATINGS... FREE!
PCAR POWR Grades
- Growth is the dimension where PCAR ranks best; there it ranks ahead of 86.17% of US stocks.
- The strongest trend for PCAR is in Quality, which has been heading up over the past 179 days.
- PCAR ranks lowest in Momentum; there it ranks in the 53rd percentile.
PCAR Stock Summary
- PCAR has a market capitalization of $38,355,285,847 -- more than approximately 93.47% of US stocks.
- PACCAR INC's stock had its IPO on July 9, 1986, making it an older stock than 93.05% of US equities in our set.
- For PCAR, its debt to operating expenses ratio is greater than that reported by 85.76% of US equities we're observing.
- Stocks with similar financial metrics, market capitalization, and price volatility to PACCAR INC are DD, CNHI, CTVA, IFF, and FMC.
- PCAR's SEC filings can be seen here. And to visit PACCAR INC's official web site, go to www.paccar.com.
PCAR Valuation Summary
- In comparison to the median Industrials stock, PCAR's price/earnings ratio is 31.63% lower, now standing at 14.7.
- Over the past 243 months, PCAR's price/sales ratio has gone up 0.6.
Below are key valuation metrics over time for PCAR.
Stock | Date | P/S | P/B | P/E | EV/EBIT |
---|---|---|---|---|---|
PCAR | 2023-02-03 | 1.4 | 3.0 | 14.7 | 13.0 |
PCAR | 2023-02-02 | 1.4 | 3.0 | 14.9 | 13.1 |
PCAR | 2023-02-01 | 1.4 | 3.0 | 14.9 | 13.1 |
PCAR | 2023-01-31 | 1.4 | 2.9 | 14.6 | 12.9 |
PCAR | 2023-01-30 | 1.4 | 2.9 | 14.5 | 12.8 |
PCAR | 2023-01-27 | 1.4 | 3.0 | 14.8 | 13.0 |
PCAR Growth Metrics
- Its 4 year net cashflow from operations growth rate is now at 38.18%.
- The year over year cash and equivalents growth rate now stands at -0.15%.
- The 5 year net income to common stockholders growth rate now stands at 48.49%.

The table below shows PCAR's growth in key financial areas (numbers in millions of US dollars).
Date | Revenue | Operating Cash Flow | Net Income to Common Stock |
---|---|---|---|
2022-09-30 | 27,376.3 | 2,814.7 | 2,601.7 |
2022-06-30 | 25,464.2 | 2,416.5 | 2,210 |
2022-03-31 | 24,149.4 | 2,109.1 | 1,982.5 |
2021-12-31 | 23,522.3 | 2,186.7 | 1,852.1 |
2021-09-30 | 22,404.8 | 1,944.9 | 1,746.5 |
2021-06-30 | 22,194 | 2,494.1 | 1,754.3 |
PCAR's Quality Factors
The “Quality” component of the POWR Ratings focuses on 31 different factors of a companies fundamentals and operational strength. Here are some key insights as we drill into the specifics of these quality attributes.- PCAR has a Quality Grade of C, ranking ahead of 40.96% of graded US stocks.
- PCAR's asset turnover comes in at 0.788 -- ranking 42nd of 68 Automobiles and Trucks stocks.
- ALSN, ALV, and F are the stocks whose asset turnover ratios are most correlated with PCAR.
The table below shows PCAR's key quality metrics over time.
Period | Asset Turnover | Gross Margin | ROIC |
---|---|---|---|
2021-09-30 | 0.788 | 0.196 | 0.075 |
2021-06-30 | 0.786 | 0.198 | 0.076 |
2021-03-31 | 0.703 | 0.198 | 0.063 |
2020-12-31 | 0.686 | 0.195 | 0.059 |
2020-09-30 | 0.706 | 0.197 | 0.065 |
2020-06-30 | 0.754 | 0.197 | 0.074 |
PCAR Price Target
For more insight on analysts targets of PCAR, see our PCAR price target page. And for a list of of all stocks sorted by upside potential based on analyst target price, see our Top Price Target page.
Average Price Target | $97.29 | Average Broker Recommendation | 1.68 (Moderate Buy) |
PCAR Stock Price Chart Interactive Chart >
PCAR Price/Volume Stats
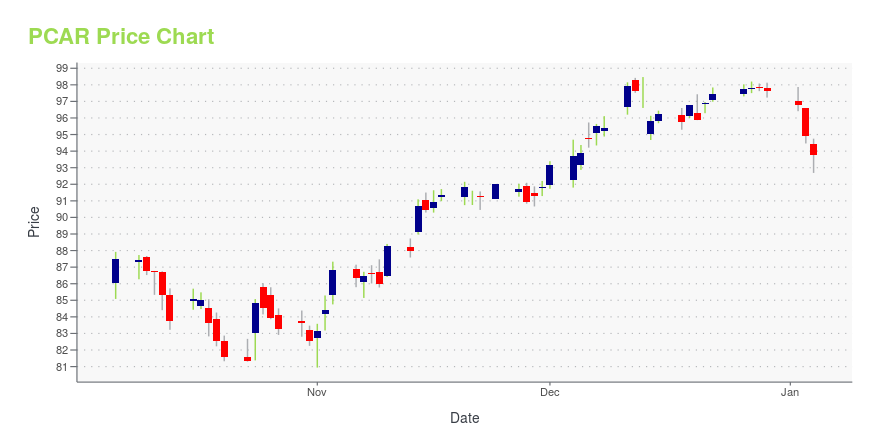
Current price | $71.95 | 52-week high | $75.26 |
Prev. close | $73.53 | 52-week low | $51.33 |
Day low | $71.91 | Volume | 3,029,800 |
Day high | $73.80 | Avg. volume | 3,645,592 |
50-day MA | $68.92 | Dividend yield | N/A |
200-day MA | $61.51 | Market Cap | 37.53B |
Paccar Inc. (PCAR) Company Bio
PACCAR Inc is an American Fortune 500 company and counts among the largest manufacturers of medium- and heavy-duty trucks in the world. PACCAR is engaged in the design, manufacture and customer support of light-, medium- and heavy-duty trucks under the Kenworth, Peterbilt, Leyland Trucks, and DAF nameplates. PACCAR also designs and manufactures powertrains, provides financial services and information technology, and distributes truck parts related to its principal business. (Source:Wikipedia)
Latest PCAR News From Around the Web
Below are the latest news stories about PACCAR INC that investors may wish to consider to help them evaluate PCAR as an investment opportunity.
PACCAR Inc (NASDAQ:PCAR) is favoured by institutional owners who hold 66% of the companyEvery investor in PACCAR Inc ( NASDAQ:PCAR ) should be aware of the most powerful shareholder groups. With 66% stake... |
PACCAR (NASDAQ:PCAR) Has Some Way To Go To Become A Multi-BaggerIf you're looking for a multi-bagger, there's a few things to keep an eye out for. One common approach is to try and... |
Auto Roundup: Q4 Earnings Snapshots of TSLA, PCAR, GPI, ALV & GNTXWhile Tesla (TSLA), PACCAR (PCAR), Group 1 (GPI), Autoliv (ALV) post better-than-expected Q4 earnings, Gentex (GNTX) lags earnings estimates by a slight margin. |
Is Nikola (NKLA) Outperforming Other Auto-Tires-Trucks Stocks This Year?Here is how Nikola (NKLA) and Paccar (PCAR) have performed compared to their sector so far this year. |
7 Industrial Stocks That Will Be Big WinnersThere are plenty of industrial stocks worth buying in today's market, including these seven. |
PCAR Price Returns
1-mo | 7.40% |
3-mo | 8.51% |
6-mo | 19.23% |
1-year | 18.50% |
3-year | 57.49% |
5-year | 94.77% |
YTD | 9.05% |
2022 | 17.00% |
2021 | 5.63% |
2020 | 11.74% |
2019 | 45.05% |
2018 | -15.32% |
Continue Researching PCAR
Here are a few links from around the web to help you further your research on Paccar Inc's stock as an investment opportunity:Paccar Inc (PCAR) Stock Price | Nasdaq
Paccar Inc (PCAR) Stock Quote, History and News - Yahoo Finance
Paccar Inc (PCAR) Stock Price and Basic Information | MarketWatch
Loading social stream, please wait...