
Pacific Gas & Electric Co. (PCG): Price and Financial Metrics
PCG Price/Volume Stats
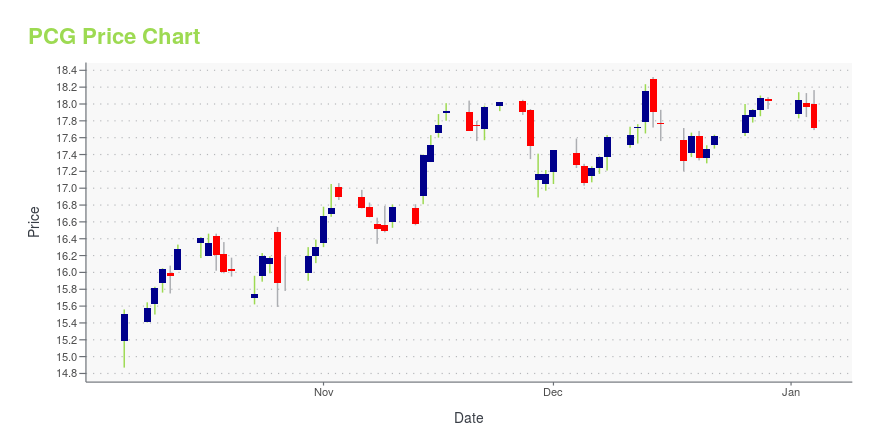
| Current price | $18.03 | 52-week high | $18.95 |
| Prev. close | $18.02 | 52-week low | $14.71 |
| Day low | $18.00 | Volume | 10,979,000 |
| Day high | $18.21 | Avg. volume | 14,413,831 |
| 50-day MA | $18.00 | Dividend yield | 0.22% |
| 200-day MA | $17.20 | Market Cap | 51.91B |
PCG Stock Price Chart Interactive Chart >
Pacific Gas & Electric Co. (PCG) Company Bio
PG&E Corporation transmits, delivers, and sells electricity and natural gas to residential, commercial, industrial, and agricultural customers primarily in northern and central California. The company was founded in 1905 and is based in San Francisco, California.
Latest PCG News From Around the Web
Below are the latest news stories about PG&E CORP that investors may wish to consider to help them evaluate PCG as an investment opportunity.
600 Miles and Counting: PG&E Hits Significant Milestone as Crews Safely Complete Construction, Energization of 350 More Miles of Underground Powerlines in 2023As of this week, Pacific Gas and Electric Company (PG&E) has constructed and energized more than 600 miles of underground powerlines since its ambitious 10,000-Mile Undergrounding program started in mid-2021. |
Rebecca Smith, Reporter Who Exposed Corruption at Enron, Dies at 68Rebecca Smith, a reporter who used her in-depth knowledge of the utility business to expose Enron’s financial deceit, the failure of California’s energy deregulation and the problems with PG&E fire-prone power lines, died on Dec. 15 from complications of an autoimmune disease. Smith, who worked at The Wall Street Journal for more than 20 years, was regarded as one of the most knowledgeable journalists covering the electricity industry, a sector that not all news organizations cover closely. “She was extremely tough-minded,” said John R. Emshwiller, a former Journal reporter who wrote “24 Days” with Smith. |
PG&E Fire Victims Will Soon Receive Final Compensation. They Won’t Be Made Whole.The victims of a series of California wildfires caused by the utility are owed $13.5 billion under a 2020 settlement, but that won’t cover all of their claims. |
Nuclear Regulatory Commission Accepts PG&E's Diablo Canyon Power Plant License Renewal Application, Allows Both Units to Continue Operating Past Current LicensesThe federal Nuclear Regulatory Commission (NRC) determined today that Pacific Gas and Electric Company's (PG&E) License Renewal Application (LRA) for extended operations of Diablo Canyon Power Plant (DCPP) is sufficient for its review. The NRC's determination of sufficiency now allows PG&E to continue operating Units 1 and 2 at DCPP past their current licenses (2024 and 2025, respectively), while the LRA is under review. |
7 Inflation-Proof Consumer Staples Stocks to Buy in DecemberWager on these seven resilient consumer staples stocks poised for robust upside in a challenging economic climate. |
PCG Price Returns
| 1-mo | 3.21% |
| 3-mo | 5.93% |
| 6-mo | 6.00% |
| 1-year | 2.27% |
| 3-year | 97.39% |
| 5-year | -1.20% |
| YTD | 0.12% |
| 2023 | 10.95% |
| 2022 | 33.94% |
| 2021 | -2.57% |
| 2020 | 14.63% |
| 2019 | -54.23% |
PCG Dividends
| Ex-Dividend Date | Type | Payout Amount | Change | ||||||
|---|---|---|---|---|---|---|---|---|---|
| Loading, please wait... | |||||||||
Continue Researching PCG
Want to see what other sources are saying about PG&E Corp's financials and stock price? Try the links below:PG&E Corp (PCG) Stock Price | Nasdaq
PG&E Corp (PCG) Stock Quote, History and News - Yahoo Finance
PG&E Corp (PCG) Stock Price and Basic Information | MarketWatch
Loading social stream, please wait...