Patterson Companies, Inc. (PDCO): Price and Financial Metrics


Patterson Companies, Inc. (PDCO): $26.57

-0.75 (-2.75%)

POWR Rating

Component Grades

Growth

S

Value

I

Momentum

G

Stability

N

Sentiment

U

Quality

P

PDCO POWR Grades

  • PDCO scores best on the Value dimension, with a Value rank ahead of 91.51% of US stocks.
  • PDCO's strongest trending metric is Quality; it's been moving up over the last 179 days.
  • PDCO ranks lowest in Momentum; there it ranks in the 15th percentile.

PDCO Stock Summary

  • The capital turnover (annual revenue relative to shareholder's equity) for PDCO is 5.8 -- better than 92.62% of US stocks.
  • Of note is the ratio of PATTERSON COMPANIES INC's sales and general administrative expense to its total operating expenses; 87.08% of US stocks have a lower such ratio.
  • The volatility of PATTERSON COMPANIES INC's share price is greater than that of just 9.39% US stocks with at least 200 days of trading history.
  • Stocks that are quantitatively similar to PDCO, based on their financial statements, market capitalization, and price volatility, are ANF, TESS, SPWH, EME, and LFVN.
  • PDCO's SEC filings can be seen here. And to visit PATTERSON COMPANIES INC's official web site, go to www.pattersoncompanies.com.

PDCO Valuation Summary

  • PDCO's price/sales ratio is 0.4; this is 78.95% lower than that of the median Healthcare stock.
  • Over the past 243 months, PDCO's price/sales ratio has gone down 1.6.

Below are key valuation metrics over time for PDCO.

Stock Date P/S P/B P/E EV/EBIT
PDCO 2023-03-17 0.4 2.2 12.6 10.9
PDCO 2023-03-16 0.4 2.3 12.8 11.0
PDCO 2023-03-15 0.4 2.3 12.8 11.0
PDCO 2023-03-14 0.4 2.3 12.9 11.1
PDCO 2023-03-13 0.4 2.3 13.0 11.1
PDCO 2023-03-10 0.4 2.3 13.1 11.2

PDCO Growth Metrics

    Its year over year net income to common stockholders growth rate is now at 30.28%.
  • The 5 year net cashflow from operations growth rate now stands at -249.67%.
  • Its 2 year cash and equivalents growth rate is now at 82.2%.
PDCO's revenue has moved up $744,581,000 over the prior 33 months.

The table below shows PDCO's growth in key financial areas (numbers in millions of US dollars).

Date Revenue Operating Cash Flow Net Income to Common Stock
2022-09-30 6,384.837 -962.141 199.547
2022-06-30 6,407.794 -970.112 193.804
2022-03-31 6,499.405 -980.994 203.21
2021-12-31 6,422.426 -959.774 168.087
2021-09-30 6,377.098 -846.529 159.84
2021-06-30 6,281.105 -814.132 165.57

PDCO's Quality Factors

The “Quality” component of the POWR Ratings focuses on 31 different factors of a companies fundamentals and operational strength. Here are some key insights as we drill into the specifics of these quality attributes.
  • PDCO has a Quality Grade of C, ranking ahead of 61.8% of graded US stocks.
  • PDCO's asset turnover comes in at 2.255 -- ranking 31st of 105 Wholesale stocks.
  • UUU, PLUS, and VOXX are the stocks whose asset turnover ratios are most correlated with PDCO.

The table below shows PDCO's key quality metrics over time.

Period Asset Turnover Gross Margin ROIC
2021-07-31 2.255 0.195 0.127
2021-04-24 2.143 0.204 0.120
2021-01-23 2.049 0.212 -0.237
2020-10-24 1.900 0.213 -0.248
2020-07-25 1.757 0.215 -0.302
2020-04-25 1.687 0.218 -0.292

PDCO Price Target

For more insight on analysts targets of PDCO, see our PDCO price target page. And for a list of of all stocks sorted by upside potential based on analyst target price, see our Top Price Target page.

Average Price Target $34.58 Average Broker Recommendation 1.88 (Hold)

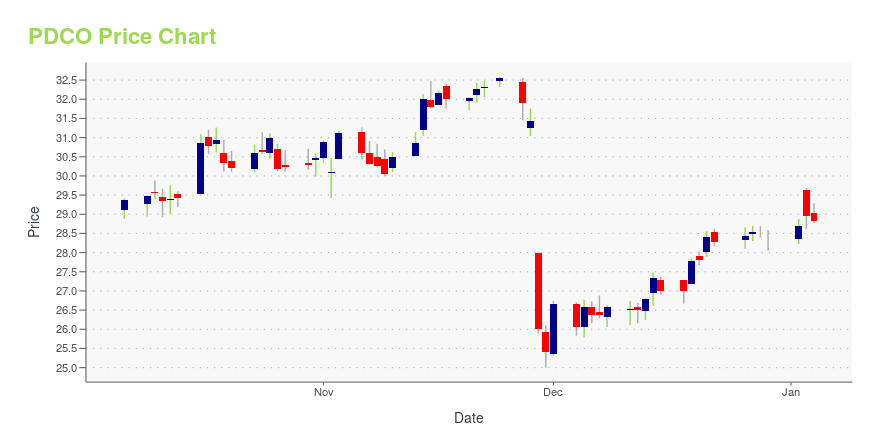
PDCO Stock Price Chart Interactive Chart >

Price chart for PDCO

PDCO Price/Volume Stats

Current price $26.57 52-week high $35.29
Prev. close $27.32 52-week low $23.87
Day low $26.54 Volume 645,000
Day high $27.49 Avg. volume 664,369
50-day MA $28.34 Dividend yield 3.95%
200-day MA $28.26 Market Cap 2.60B

Patterson Companies, Inc. (PDCO) Company Bio


Patterson Companies distributes dental, veterinary, and rehabilitation supplies. The Company operates through three segments: dental supply, veterinary supply and rehabilitation supply. The company was founded in 1877 and is based in St. Paul, Minnesota.


PDCO Latest News Stream


Event/Time News Detail
Loading, please wait...

PDCO Latest Social Stream


Loading social stream, please wait...

View Full PDCO Social Stream

Latest PDCO News From Around the Web

Below are the latest news stories about PATTERSON COMPANIES INC that investors may wish to consider to help them evaluate PDCO as an investment opportunity.

The 7 Best Retirement Stocks for Anxious Investors

With wild rumblings in the equities space, investors may need to change strategies regarding the best retirement stocks.

Josh Enomoto on InvestorPlace | March 14, 2023

Patterson Companies Declares Regular Quarterly Cash Dividend

ST. PAUL, Minn., March 14, 2023--On March 14, 2023, the Board of Directors of Patterson Companies, Inc. (Nasdaq: PDCO) declared a quarterly cash dividend of $0.26 per share. The dividend will be payable on, or about, May 5, 2023, to shareholders of record as of the close of business on April 21, 2023.

Yahoo | March 14, 2023

Q3 2023 Patterson Companies Inc Earnings Call

Q3 2023 Patterson Companies Inc Earnings Call

Yahoo | March 3, 2023

Patterson Companies (PDCO) Q3 Earnings Beat, Sales Hurt by FX

Patterson Companies' (PDCO) fiscal third-quarter 2023 results are negatively impacted by unfavorable currency movements.

Yahoo | March 2, 2023

Patterson Companies Reports Fiscal 2023 Third Quarter Operating Results

ST. PAUL, Minn., March 02, 2023--Patterson Companies, Inc. (Nasdaq: PDCO) today reported consolidated net sales of $1.60 billion (see attached Sales Summary for further details) in its fiscal third quarter ended January 28, 2023, an increase of 0.3 percent compared to the same period last year. Internal sales, which are adjusted for the effects of currency translation and contributions from recent acquisitions, increased 1.8 percent over the prior year period.

Yahoo | March 2, 2023

Read More 'PDCO' Stories Here

PDCO Price Returns

1-mo -5.88%
3-mo -4.04%
6-mo 7.11%
1-year -11.98%
3-year 84.30%
5-year 50.47%
YTD -4.35%
2022 -1.06%
2021 2.33%
2020 52.26%
2019 9.74%
2018 -43.34%

PDCO Dividends

Ex-Dividend Date Type Payout Amount Change
Loading, please wait...
View Full PDCO Dividend History

Get Free Updates

Join thousands of investors who get the latest news, insights and top rated picks from StockNews.com!


Page generated in 0.7742 seconds.