Peoples Bancorp Inc. (PEBO): Price and Financial Metrics
GET POWR RATINGS... FREE!
PEBO POWR Grades
- PEBO scores best on the Stability dimension, with a Stability rank ahead of 83.07% of US stocks.
- PEBO's strongest trending metric is Growth; it's been moving down over the last 177 days.
- PEBO ranks lowest in Sentiment; there it ranks in the 29th percentile.
PEBO Stock Summary
- Over the past twelve months, PEBO has reported earnings growth of 162.78%, putting it ahead of 90.63% of US stocks in our set.
- In terms of volatility of its share price, PEBO is more volatile than just 2.79% of stocks we're observing.
- Shareholder yield, a measure of how much is returned to shareholders via dividends and share repurchases, for PEBO comes in at 23.82% -- higher than that of 94.24% of stocks in our set.
- Stocks that are quantitatively similar to PEBO, based on their financial statements, market capitalization, and price volatility, are MBIN, OVBC, NKSH, FCBC, and CCNE.
- Visit PEBO's SEC page to see the company's official filings. To visit the company's web site, go to www.peoplesbancorp.com.
PEBO Valuation Summary
- In comparison to the median Financial Services stock, PEBO's price/earnings ratio is 31.58% lower, now standing at 7.8.
- Over the past 243 months, PEBO's price/sales ratio has gone down 0.8.
Below are key valuation metrics over time for PEBO.
Stock | Date | P/S | P/B | P/E | EV/EBIT |
---|---|---|---|---|---|
PEBO | 2023-01-23 | 2.4 | 1.0 | 7.8 | 7.0 |
PEBO | 2023-01-20 | 2.4 | 1.1 | 7.8 | 7.0 |
PEBO | 2023-01-19 | 2.4 | 1.0 | 7.7 | 6.9 |
PEBO | 2023-01-18 | 2.4 | 1.0 | 7.6 | 6.8 |
PEBO | 2023-01-17 | 2.4 | 1.1 | 7.8 | 7.0 |
PEBO | 2023-01-13 | 2.5 | 1.1 | 8.0 | 7.1 |
PEBO Growth Metrics
- Its 5 year net income to common stockholders growth rate is now at 20.61%.
- The 4 year cash and equivalents growth rate now stands at 154.45%.
- Its year over year net income to common stockholders growth rate is now at 9.17%.

The table below shows PEBO's growth in key financial areas (numbers in millions of US dollars).
Date | Revenue | Operating Cash Flow | Net Income to Common Stock |
---|---|---|---|
2022-09-30 | 329.596 | 192.198 | 102.19 |
2022-06-30 | 293.885 | 180.453 | 70.454 |
2022-03-31 | 264.644 | 153.808 | 55.669 |
2021-12-31 | 240.707 | 156.42 | 47.555 |
2021-09-30 | 217.639 | 96.213 | 40.381 |
2021-06-30 | 214.87 | 94.116 | 56.349 |
PEBO's Quality Factors
The “Quality” component of the POWR Ratings focuses on 31 different factors of a companies fundamentals and operational strength. Here are some key insights as we drill into the specifics of these quality attributes.- PEBO has a Quality Grade of C, ranking ahead of 30.76% of graded US stocks.
- PEBO's asset turnover comes in at 0.043 -- ranking 129th of 430 Banking stocks.
- FULT, PNFP, and LBAI are the stocks whose asset turnover ratios are most correlated with PEBO.
The table below shows PEBO's key quality metrics over time.
Period | Asset Turnover | Gross Margin | ROIC |
---|---|---|---|
2021-06-30 | 0.043 | 1 | 0.014 |
2021-03-31 | 0.040 | 1 | 0.013 |
2020-12-31 | 0.037 | 1 | 0.009 |
2020-09-30 | 0.036 | 1 | 0.008 |
2020-06-30 | 0.038 | 1 | 0.009 |
2020-03-31 | 0.043 | 1 | 0.011 |
PEBO Price Target
For more insight on analysts targets of PEBO, see our PEBO price target page. And for a list of of all stocks sorted by upside potential based on analyst target price, see our Top Price Target page.
Average Price Target | $36.17 | Average Broker Recommendation | 1.64 (Moderate Buy) |
PEBO Stock Price Chart Interactive Chart >
PEBO Price/Volume Stats
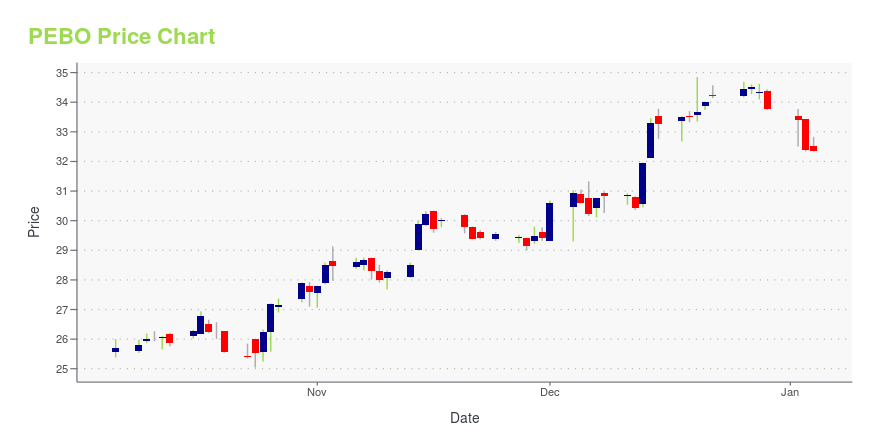
Current price | $30.27 | 52-week high | $33.33 |
Prev. close | $30.17 | 52-week low | $25.63 |
Day low | $29.64 | Volume | 135,800 |
Day high | $30.30 | Avg. volume | 103,200 |
50-day MA | $28.92 | Dividend yield | 5.02% |
200-day MA | $28.96 | Market Cap | 856.28M |
Peoples Bancorp Inc. (PEBO) Company Bio
Peoples Bancorp operates as the holding company for Peoples Bank, National Association that provides a range of financial products and services for clients in Ohio, West Virginia, and Kentucky. The company was founded in 1902 and is based in Marietta, Ohio.
Latest PEBO News From Around the Web
Below are the latest news stories about PEOPLES BANCORP INC that investors may wish to consider to help them evaluate PEBO as an investment opportunity.
PEOPLES BANCORP INC. ANNOUNCES PLANNED RETIREMENT OF GEORGE W. BROUGHTON FROM BOARD OF DIRECTORSPeoples Bancorp Inc. ("Peoples") (NASDAQ: PEBO) today announced that, after 33 years of dedicated service, George W. Broughton plans to retire from the Board of Directors of Peoples and the Board of Directors of Peoples' banking subsidiary, Peoples Bank, each effective when his current term ends on April 27, 2023. Mr. Broughton has served on the Boards of Directors of Peoples and Peoples Bank since 1994 and 1990, respectively, and as Vice Chairman of the Board of Directors of both companies sinc |
Here's What We Like About Peoples Bancorp's (NASDAQ:PEBO) Upcoming DividendRegular readers will know that we love our dividends at Simply Wall St, which is why it's exciting to see Peoples... |
Peoples Bancorp Inc. (NASDAQ:PEBO) Q4 2022 Earnings Call TranscriptPeoples Bancorp Inc. (NASDAQ:PEBO) Q4 2022 Earnings Call Transcript January 24, 2023 Operator: Good morning, and welcome to Peoples Bancorp Inc. Conference Call. My name is Betsy, and I will be your conference facilitator. Today’s call will cover a discussion of the results of operations for the quarterly and fiscal year ended December 31, 2022. […] |
Peoples Bancorp (PEBO) Tops Q4 Earnings and Revenue EstimatesPeoples Bancorp (PEBO) delivered earnings and revenue surprises of 4.26% and 1.13%, respectively, for the quarter ended December 2022. Do the numbers hold clues to what lies ahead for the stock? |
PEOPLES BANCORP INC. DECLARES QUARTERLY DIVIDENDThe Board of Directors of Peoples Bancorp Inc. ("Peoples") (Nasdaq: PEBO) declared a quarterly cash dividend of $0.38 per common share on January 23, 2023, payable on February 21, 2023, to shareholders of record on February 6, 2023. |
PEBO Price Returns
1-mo | 7.19% |
3-mo | 3.25% |
6-mo | 1.85% |
1-year | -2.43% |
3-year | 6.30% |
5-year | 11.33% |
YTD | 8.52% |
2022 | -6.61% |
2021 | 22.84% |
2020 | -17.32% |
2019 | 20.00% |
2018 | -4.75% |
PEBO Dividends
Ex-Dividend Date | Type | Payout Amount | Change | ||||||
---|---|---|---|---|---|---|---|---|---|
Loading, please wait... |
Continue Researching PEBO
Want to see what other sources are saying about Peoples Bancorp Inc's financials and stock price? Try the links below:Peoples Bancorp Inc (PEBO) Stock Price | Nasdaq
Peoples Bancorp Inc (PEBO) Stock Quote, History and News - Yahoo Finance
Peoples Bancorp Inc (PEBO) Stock Price and Basic Information | MarketWatch
Loading social stream, please wait...