Provident Financial Services, Inc (PFS): Price and Financial Metrics
PFS Price/Volume Stats
Current price | $14.57 | 52-week high | $19.80 |
Prev. close | $14.38 | 52-week low | $13.43 |
Day low | $14.24 | Volume | 1,082,400 |
Day high | $14.65 | Avg. volume | 642,107 |
50-day MA | $15.58 | Dividend yield | 6.89% |
200-day MA | $16.24 | Market Cap | 1.10B |
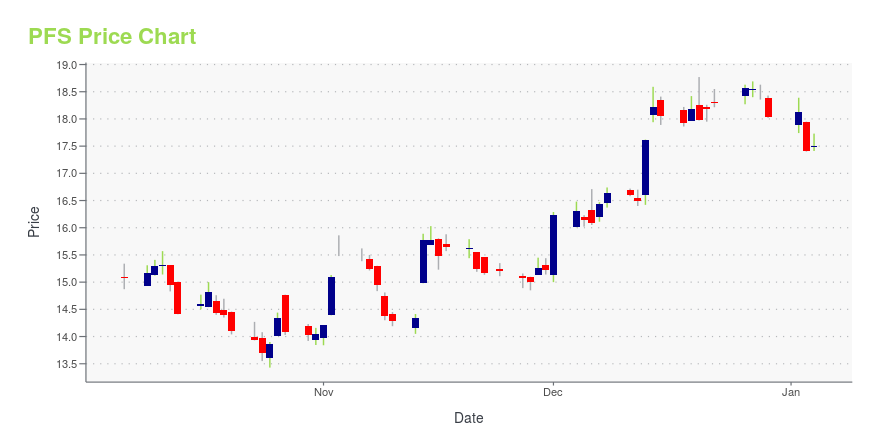
PFS Stock Price Chart Interactive Chart >
PFS POWR Grades
- Value is the dimension where PFS ranks best; there it ranks ahead of 63.63% of US stocks.
- PFS's strongest trending metric is Growth; it's been moving down over the last 26 weeks.
- PFS ranks lowest in Growth; there it ranks in the 4th percentile.
PFS Stock Summary
- For PFS, its debt to operating expenses ratio is greater than that reported by 88.73% of US equities we're observing.
- With a year-over-year growth in debt of 89.28%, PROVIDENT FINANCIAL SERVICES INC's debt growth rate surpasses 91.09% of about US stocks.
- PROVIDENT FINANCIAL SERVICES INC's shareholder yield -- a measure of how much capital is returned to stockholders via dividends and buybacks -- is -67.54%, greater than the shareholder yield of just 6.21% of stocks in our set.
- Stocks that are quantitatively similar to PFS, based on their financial statements, market capitalization, and price volatility, are WAFD, BANC, BHB, HOPE, and TBNK.
- Visit PFS's SEC page to see the company's official filings. To visit the company's web site, go to www.provident.bank.
PFS Valuation Summary
- In comparison to the median Financial Services stock, PFS's price/sales ratio is 150% higher, now standing at 3.
- Over the past 243 months, PFS's price/sales ratio has gone down 5.1.
Below are key valuation metrics over time for PFS.
Stock | Date | P/S | P/B | P/E | EV/EBIT |
---|---|---|---|---|---|
PFS | 2023-12-22 | 3.0 | 0.9 | 9.2 | 15.9 |
PFS | 2023-12-21 | 2.9 | 0.8 | 9.2 | 15.8 |
PFS | 2023-12-20 | 2.9 | 0.8 | 9.1 | 15.8 |
PFS | 2023-12-19 | 3.0 | 0.8 | 9.2 | 15.8 |
PFS | 2023-12-18 | 2.9 | 0.8 | 9.0 | 15.7 |
PFS | 2023-12-15 | 2.9 | 0.8 | 9.1 | 15.8 |
PFS Growth Metrics
- The 3 year price growth rate now stands at -15.39%.
- Its 5 year net cashflow from operations growth rate is now at 12.1%.
- Its 3 year net income to common stockholders growth rate is now at 34.57%.
The table below shows PFS's growth in key financial areas (numbers in millions of US dollars).
Date | Revenue | Operating Cash Flow | Net Income to Common Stock |
---|---|---|---|
2022-09-30 | 482.158 | 192.264 | 163.914 |
2022-06-30 | 466.258 | 171.631 | 157.761 |
2022-03-31 | 471.612 | 172.901 | 163.322 |
2021-12-31 | 477.171 | 158.182 | 167.921 |
2021-09-30 | 474.508 | 186.079 | 171.183 |
2021-06-30 | 457.098 | 131.623 | 161.058 |
PFS's Quality Factors
The “Quality” component of the POWR Ratings focuses on 31 different factors of a companies fundamentals and operational strength. Here are some key insights as we drill into the specifics of these quality attributes.- PFS has a Quality Grade of C, ranking ahead of 32.05% of graded US stocks.
- PFS's asset turnover comes in at 0.035 -- ranking 280th of 428 Banking stocks.
- RM, ESXB, and WSBC are the stocks whose asset turnover ratios are most correlated with PFS.
The table below shows PFS's key quality metrics over time.
Period | Asset Turnover | Gross Margin | ROIC |
---|---|---|---|
2021-06-30 | 0.035 | 1 | 0.016 |
2021-03-31 | 0.033 | 1 | 0.014 |
2020-12-31 | 0.031 | 1 | 0.011 |
2020-09-30 | 0.031 | 1 | 0.010 |
2020-06-30 | 0.032 | 1 | 0.011 |
2020-03-31 | 0.034 | 1 | 0.012 |
PFS Price Target
For more insight on analysts targets of PFS, see our PFS price target page. And for a list of of all stocks sorted by upside potential based on analyst target price, see our Top Price Target page.
Average Price Target | $25.40 | Average Broker Recommendation | 1.83 (Hold) |
Provident Financial Services, Inc (PFS) Company Bio
Provident Financial Services provides banking services to individuals, families, and businesses in New Jersey. The company was founded in 1839 and is based in Jersey City, New Jersey.
Latest PFS News From Around the Web
Below are the latest news stories about PROVIDENT FINANCIAL SERVICES INC that investors may wish to consider to help them evaluate PFS as an investment opportunity.
Provident (PFS) & Lakeland (LBAI) Extend Merger AgreementProvident (PFS) and Lakeland (LBAI) announce the extension of their merger agreement to the end of first-quarter 2024, which was initially expected to close in second-quarter 2023. |
Provident, Lakeland extend merger agreementThe deal, originally projected to close earlier this year, has been extended through March. |
New Jersey banks extend deadline to close their $1.3 billion mergerProvident Financial in Iselin initially anticipated completing its deal for Oak Ridge-based Lakeland Bancorp in the second quarter. Now as it waits for regulatory approval, Provident says the process will stretch into spring 2024. |
Provident Financial Services, Inc. and Lakeland Bancorp, Inc. Extend Merger AgreementISELIN, N.J. and OAK RIDGE, N.J., Dec. 20, 2023 (GLOBE NEWSWIRE) -- Provident Financial Services, Inc. (NYSE:PFS) (“Provident”), the parent company of Provident Bank, and Lakeland Bancorp, Inc. (Nasdaq: LBAI) (“Lakeland”), the parent company of Lakeland Bank, today announced that the two companies have agreed to extend their merger agreement to March 31, 2024, to provide additional time to obtain the required regulatory approvals. Both parties remain committed to the merger and to obtaining regu |
National Survey by Provident Bank Finds Businesses Expect Economy to Improve in 2024 Despite InflationThe 2024 Economic Outlook Survey revealed 61% of businesses expect to increase hiring in 2024 Word Cloud Respondents provided specific examples of how rising interest rates have affected their businesses. ISELIN, N.J., Dec. 14, 2023 (GLOBE NEWSWIRE) -- Provident Bank, a leading New Jersey-based financial institution, has released the results of its 2024 Economic Outlook Survey. The survey polled owners and executives of businesses in the U.S. with annual revenues over $1 million to explore predi |
PFS Price Returns
1-mo | -1.42% |
3-mo | -17.90% |
6-mo | -1.61% |
1-year | -18.82% |
3-year | -24.76% |
5-year | -28.23% |
YTD | -17.90% |
2023 | -10.79% |
2022 | -8.03% |
2021 | 40.47% |
2020 | -22.53% |
2019 | 6.71% |
PFS Dividends
Ex-Dividend Date | Type | Payout Amount | Change | ||||||
---|---|---|---|---|---|---|---|---|---|
Loading, please wait... |
Continue Researching PFS
Want to do more research on Provident Financial Services Inc's stock and its price? Try the links below:Provident Financial Services Inc (PFS) Stock Price | Nasdaq
Provident Financial Services Inc (PFS) Stock Quote, History and News - Yahoo Finance
Provident Financial Services Inc (PFS) Stock Price and Basic Information | MarketWatch
Loading social stream, please wait...