
Paramount Group, Inc. (PGRE): Price and Financial Metrics
PGRE Price/Volume Stats
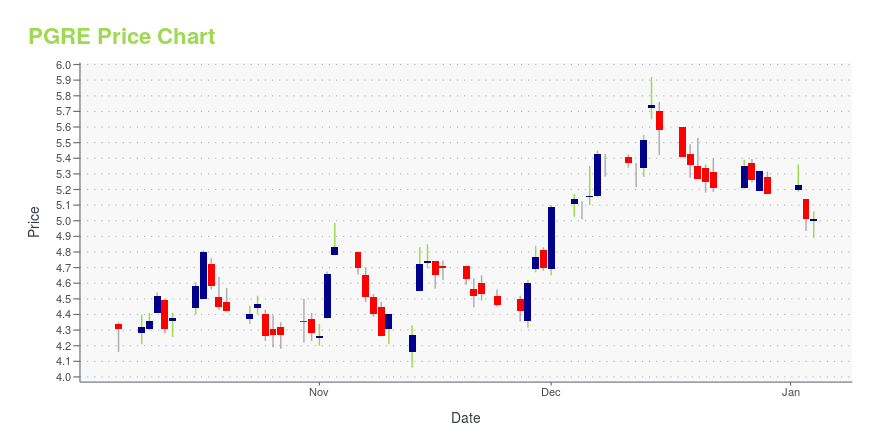
| Current price | $5.35 | 52-week high | $5.92 |
| Prev. close | $5.13 | 52-week low | $4.06 |
| Day low | $5.16 | Volume | 1,495,603 |
| Day high | $5.35 | Avg. volume | 1,203,351 |
| 50-day MA | $4.76 | Dividend yield | 2.63% |
| 200-day MA | $4.74 | Market Cap | 1.16B |
PGRE Stock Price Chart Interactive Chart >
Paramount Group, Inc. (PGRE) Company Bio
Paramount Group owns, operates, manages, acquires and redevelops high-quality, Class A office properties located in select central business district submarkets of New York City, Washington, D.C. and San Francisco. The company was founded in 1978 and is based in New York, New York.
Latest PGRE News From Around the Web
Below are the latest news stories about PARAMOUNT GROUP INC that investors may wish to consider to help them evaluate PGRE as an investment opportunity.
Paramount Declares Regular Quarterly DividendNEW YORK, December 15, 2023--Paramount Group, Inc. (NYSE: PGRE) ("Paramount") announced today that its board of directors has declared a regular quarterly cash dividend of $0.035 per share of common stock for the period from October 1, 2023 to December 31, 2023. The dividend will be payable on January 12, 2024, to stockholders of record as of the close of business on December 29, 2023. |
BofA Securities Downgraded These 3 Office REITsThe office real estate investment trust (REIT) sector, which has suffered through a harsh bear market since the beginning of 2022, continues to face difficulties with declining occupancy levels and higher expenses. This week, BofA Securities analyst Camille Bonnel downgraded three of the weakest office REITs in the subsector. "For all three of these office REITs, more than a quarter of their leases expire through 2025, which implies higher leasing costs dragging on cash flows," Bonnel said. Take |
Paramount Achieves GRESB 5 Star Rating for Fifth Consecutive YearNEW YORK, November 09, 2023--Paramount Group, Inc. (NYSE: PGRE) ("Paramount" or the "Company") announced today that it achieved a 5 Star rating in the 2023 GRESB Real Estate Assessment. Maintaining the highest GRESB rating for the fifth consecutive year is an impressive feat, especially given that survey participation increased in 2023 by 15% to include 2,084 listed and non-listed portfolios across 75 countries. Paramount was a top performer within both the Management and Performance scoring cat |
Paramount Group, Inc. (NYSE:PGRE) Q3 2023 Earnings Call TranscriptParamount Group, Inc. (NYSE:PGRE) Q3 2023 Earnings Call Transcript November 5, 2023 Operator: Good day, ladies and gentlemen. Thank you for standing by. Welcome to the Paramount Group Third Quarter 2023 Earnings Conference Call. At this time, all participants are in a listen-only mode. A question-and-answer session will follow the formal presentation. Please note that […] |
Paramount Group Inc (PGRE) Reports Q3 2023 Earnings, Net Loss WidensCompany's net loss attributable to common stockholders increased to $8.4 million in Q3 2023 from $1.5 million in Q3 2022 |
PGRE Price Returns
| 1-mo | 19.81% |
| 3-mo | 15.45% |
| 6-mo | 7.82% |
| 1-year | 7.89% |
| 3-year | -39.51% |
| 5-year | -53.24% |
| YTD | 5.11% |
| 2023 | -9.44% |
| 2022 | -25.62% |
| 2021 | -4.95% |
| 2020 | -31.98% |
| 2019 | 14.13% |
PGRE Dividends
| Ex-Dividend Date | Type | Payout Amount | Change | ||||||
|---|---|---|---|---|---|---|---|---|---|
| Loading, please wait... | |||||||||
Continue Researching PGRE
Want to see what other sources are saying about Paramount Group Inc's financials and stock price? Try the links below:Paramount Group Inc (PGRE) Stock Price | Nasdaq
Paramount Group Inc (PGRE) Stock Quote, History and News - Yahoo Finance
Paramount Group Inc (PGRE) Stock Price and Basic Information | MarketWatch
Loading social stream, please wait...