Pieris Pharmaceuticals, Inc. (PIRS): Price and Financial Metrics
PIRS Price/Volume Stats
Current price | $0.18 | 52-week high | $1.29 |
Prev. close | $0.19 | 52-week low | $0.14 |
Day low | $0.18 | Volume | 468,800 |
Day high | $0.19 | Avg. volume | 595,003 |
50-day MA | $0.17 | Dividend yield | N/A |
200-day MA | $0.24 | Market Cap | 18.11M |
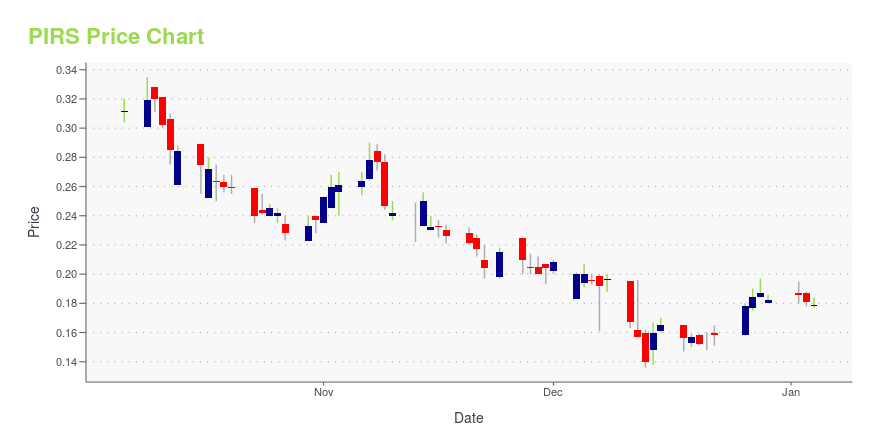
PIRS Stock Price Chart Interactive Chart >
PIRS Stock Summary
- As for revenue growth, note that PIRS's revenue has grown 66.17% over the past 12 months; that beats the revenue growth of 93.15% of US companies in our set.
- The volatility of PIERIS PHARMACEUTICALS INC's share price is greater than that of 96.1% US stocks with at least 200 days of trading history.
- Shareholder yield, a measure of how much is returned to shareholders via dividends and share repurchases, for PIRS comes in at -111.08% -- higher than that of just 3.87% of stocks in our set.
- Stocks with similar financial metrics, market capitalization, and price volatility to PIERIS PHARMACEUTICALS INC are SMR, INO, SRZN, WDC, and SPCE.
- Visit PIRS's SEC page to see the company's official filings. To visit the company's web site, go to www.pieris.com.
PIRS Valuation Summary
- PIRS's EV/EBIT ratio is 0.1; this is 99.32% lower than that of the median Healthcare stock.
- Over the past 110 months, PIRS's price/earnings ratio has gone up 7.2.
Below are key valuation metrics over time for PIRS.
Stock | Date | P/S | P/B | P/E | EV/EBIT |
---|---|---|---|---|---|
PIRS | 2023-12-29 | 0.4 | 0.6 | -0.6 | 0.1 |
PIRS | 2023-12-28 | 0.4 | 0.6 | -0.7 | 0.1 |
PIRS | 2023-12-27 | 0.4 | 0.6 | -0.6 | 0.1 |
PIRS | 2023-12-26 | 0.4 | 0.6 | -0.6 | 0.1 |
PIRS | 2023-12-22 | 0.3 | 0.5 | -0.6 | 0.2 |
PIRS | 2023-12-21 | 0.3 | 0.5 | -0.5 | 0.2 |
PIRS Growth Metrics
- The year over year net cashflow from operations growth rate now stands at 57.66%.
- Its 2 year price growth rate is now at -43.71%.
- Its 5 year revenue growth rate is now at 760.34%.
The table below shows PIRS's growth in key financial areas (numbers in millions of US dollars).
Date | Revenue | Operating Cash Flow | Net Income to Common Stock |
---|---|---|---|
2022-09-30 | 28.499 | -57.943 | -34.707 |
2022-06-30 | 27.186 | -63.649 | -41.507 |
2022-03-31 | 26.773 | -18.165 | -46.667 |
2021-12-31 | 31.418 | -7.66 | -45.738 |
2021-09-30 | 24.852 | -10.133 | -50.606 |
2021-06-30 | 23.734 | -3.219 | -48.353 |
PIRS's Quality Factors
The “Quality” component of the POWR Ratings focuses on 31 different factors of a companies fundamentals and operational strength. Here are some key insights as we drill into the specifics of these quality attributes.- PIRS has a Quality Grade of C, ranking ahead of 27.39% of graded US stocks.
- PIRS's asset turnover comes in at 0.193 -- ranking 490th of 561 Business Services stocks.
- NXTD, ATVI, and AEYE are the stocks whose asset turnover ratios are most correlated with PIRS.
The table below shows PIRS's key quality metrics over time.
Period | Asset Turnover | Gross Margin | ROIC |
---|---|---|---|
2021-06-30 | 0.193 | 1 | -1.697 |
2021-03-31 | 0.279 | 1 | -0.852 |
2020-12-31 | 0.254 | 1 | -0.693 |
2020-09-30 | 0.359 | 1 | -0.373 |
2020-06-30 | 0.456 | 1 | -0.199 |
2020-03-31 | 0.398 | 1 | -0.367 |
PIRS Price Target
For more insight on analysts targets of PIRS, see our PIRS price target page. And for a list of of all stocks sorted by upside potential based on analyst target price, see our Top Price Target page.
Average Price Target | $8.50 | Average Broker Recommendation | 1.25 (Strong Buy) |
Pieris Pharmaceuticals, Inc. (PIRS) Company Bio
Pieris Pharmaceuticals, Inc., a clinical stage biopharmaceutical company, discovers and develops Anticalin-based drugs. The company develops Anticalin proteins that are low molecular-weight therapeutic proteins derived from lipocalins, which are naturally occurring low-molecular weight human proteins found in blood plasma and other bodily fluids. The company is based in Boston, Massachusetts.
Latest PIRS News From Around the Web
Below are the latest news stories about PIERIS PHARMACEUTICALS INC that investors may wish to consider to help them evaluate PIRS as an investment opportunity.
Will Pieris Pharmaceuticals (NASDAQ:PIRS) Spend Its Cash Wisely?Just because a business does not make any money, does not mean that the stock will go down. For example, biotech and... |
Today’s Biggest Pre-Market Stock Movers: 10 Top Gainers and Losers on WednesdayPre-market stock movers are worth keeping track of and we're helping with the biggest winners and losers for Wednesday morning! |
Pieris Pharmaceuticals (PIRS) Upgraded to Strong Buy: Here's WhyPieris Pharmaceuticals (PIRS) has been upgraded to a Zacks Rank #1 (Strong Buy), reflecting growing optimism about the company's earnings prospects. This might drive the stock higher in the near term. |
Today’s Biggest Pre-Market Stock Movers: 10 Top Gainers and Losers on FridayIt's time to close out this week of trading with an overview of the biggest pre-market stock movers to watch Friday morning! |
Is Pieris Pharmaceuticals (PIRS) a Value Trap? A Comprehensive AnalysisUnpacking the Risks and Rewards of Investing in Pieris Pharmaceuticals |
PIRS Price Returns
1-mo | 5.82% |
3-mo | -1.10% |
6-mo | -39.60% |
1-year | -82.52% |
3-year | -92.80% |
5-year | -94.63% |
YTD | -1.10% |
2023 | -82.50% |
2022 | -72.49% |
2021 | 51.20% |
2020 | -30.94% |
2019 | 36.09% |
Continue Researching PIRS
Want to see what other sources are saying about Pieris Pharmaceuticals Inc's financials and stock price? Try the links below:Pieris Pharmaceuticals Inc (PIRS) Stock Price | Nasdaq
Pieris Pharmaceuticals Inc (PIRS) Stock Quote, History and News - Yahoo Finance
Pieris Pharmaceuticals Inc (PIRS) Stock Price and Basic Information | MarketWatch
Loading social stream, please wait...