Plumas Bancorp (PLBC): Price and Financial Metrics


Plumas Bancorp (PLBC): $33.40

0.30 (+0.91%)

POWR Rating

Component Grades

Growth

S

Value

I

Momentum

G

Stability

N

Sentiment

U

Quality

P

PLBC POWR Grades

  • Momentum is the dimension where PLBC ranks best; there it ranks ahead of 82.98% of US stocks.
  • The strongest trend for PLBC is in Quality, which has been heading down over the past 148 days.
  • PLBC's current lowest rank is in the Quality metric (where it is better than 25.82% of US stocks).

PLBC Stock Summary

  • PLBC's current price/earnings ratio is 7.33, which is higher than merely 21.03% of US stocks with positive earnings.
  • The price/operating cash flow metric for PLUMAS BANCORP is higher than just 16.38% of stocks in our set with a positive cash flow.
  • Equity multiplier, or assets relative to shareholders' equity, comes in at 14.02 for PLUMAS BANCORP; that's greater than it is for 95.83% of US stocks.
  • Stocks with similar financial metrics, market capitalization, and price volatility to PLUMAS BANCORP are WABC, NKSH, CCNE, SYBT, and FBNC.
  • Visit PLBC's SEC page to see the company's official filings. To visit the company's web site, go to www.plumasbank.com.

PLBC Valuation Summary

  • In comparison to the median Financial Services stock, PLBC's price/sales ratio is 180% higher, now standing at 2.8.
  • Over the past 243 months, PLBC's EV/EBIT ratio has gone up 1.5.

Below are key valuation metrics over time for PLBC.

Stock Date P/S P/B P/E EV/EBIT
PLBC 2023-03-17 2.8 1.6 7.3 1.1
PLBC 2023-03-16 2.9 1.7 7.5 1.3
PLBC 2023-03-15 2.9 1.8 7.8 -3.7
PLBC 2023-03-14 3.2 1.9 8.6 -3.2
PLBC 2023-03-13 3.2 1.9 8.5 -3.2
PLBC 2023-03-10 3.8 2.3 10.1 -2.0

PLBC Growth Metrics

    Its year over year net income to common stockholders growth rate is now at 42.86%.
  • Its 4 year net income to common stockholders growth rate is now at 88.45%.
  • Its year over year cash and equivalents growth rate is now at 66.52%.
Over the past 67 months, PLBC's revenue has gone up $32,144,000.

The table below shows PLBC's growth in key financial areas (numbers in millions of US dollars).

Date Revenue Operating Cash Flow Net Income to Common Stock
2022-09-30 64.236 51.503 24.129
2022-06-30 61.567 26.432 23.479
2022-03-31 57.436 5.847 22.286
2021-12-31 54.525 -8.418 21.009
2021-09-30 51.587 -1.872 19.788
2021-06-30 47.182 10.642 16.902

PLBC's Quality Factors

The “Quality” component of the POWR Ratings focuses on 31 different factors of a companies fundamentals and operational strength. Here are some key insights as we drill into the specifics of these quality attributes.
  • PLBC has a Quality Grade of C, ranking ahead of 38.46% of graded US stocks.
  • PLBC's asset turnover comes in at 0.04 -- ranking 177th of 436 Banking stocks.
  • CFR, PNC, and FBMS are the stocks whose asset turnover ratios are most correlated with PLBC.

The table below shows PLBC's key quality metrics over time.

Period Asset Turnover Gross Margin ROIC
2021-06-30 0.040 1 0.024
2021-03-31 0.041 1 0.022
2020-12-31 0.042 1 0.021
2020-09-30 0.043 1 0.021
2020-06-30 0.047 1 0.023
2020-03-31 0.051 1 0.025

PLBC Stock Price Chart Interactive Chart >

Price chart for PLBC

PLBC Price/Volume Stats
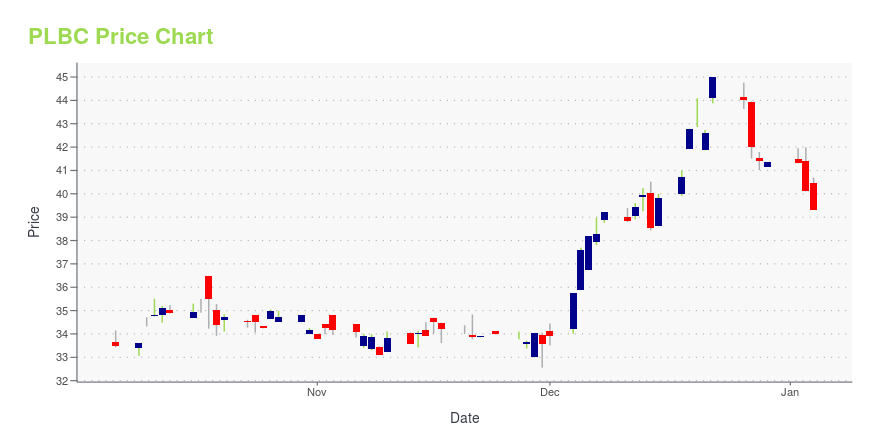
Current price $33.40 52-week high $45.31
Prev. close $33.10 52-week low $26.48
Day low $33.08 Volume 7,500
Day high $33.97 Avg. volume 14,605
50-day MA $40.08 Dividend yield 2.93%
200-day MA $33.76 Market Cap 195.72M

Plumas Bancorp (PLBC) Company Bio


Plumas Bancorp is the holding company for Plumas Bank, a community bank serving customers through several offices located Northeastern California. The Bank provides deposit, lending, mortgage, and commercial banking products and services to business and retail customers. Plumas Bank also provides banking services to agribusinesses, and offers mutual funds and insurance services.


PLBC Latest News Stream


Event/Time News Detail
Loading, please wait...

PLBC Latest Social Stream


Loading social stream, please wait...

View Full PLBC Social Stream

Latest PLBC News From Around the Web

Below are the latest news stories about PLUMAS BANCORP that investors may wish to consider to help them evaluate PLBC as an investment opportunity.

Plumas Bancorp Full Year 2022 Earnings: EPS: US$4.53 (vs US$3.82 in FY 2021)

Plumas Bancorp ( NASDAQ:PLBC ) Full Year 2022 Results Key Financial Results Revenue: US$68.3m (up 25% from FY 2021...

Yahoo | March 20, 2023

Stonegate Capital Partners Updates Coverage On Plumas Bancorp (PLBC) 2022 Q4

Dallas, Texas--(Newsfile Corp. - March 6, 2023) - Plumas Bancorp (NASDAQ: PLBC): Stonegate Capital Partners updates coverage on Plumas Bancorp (Nasdaq: PLBC). The full report can be accessed by clicking on the following link: https://stonegateinc.com/reports/PLBC_4Q22.pdf. To view the full announcement, including downloadable images, bios, and more, click here. ...

Yahoo | March 6, 2023

Here's Why We Think Plumas Bancorp (NASDAQ:PLBC) Is Well Worth Watching

Investors are often guided by the idea of discovering 'the next big thing', even if that means buying 'story stocks...

Yahoo | February 7, 2023

Plumas Bancorp Declares Quarterly Cash Dividend

RENO, Nev., Jan. 19, 2023 (GLOBE NEWSWIRE) -- Plumas Bancorp (Nasdaq:PLBC), the parent company of Plumas Bank (the “Bank”), today announced that the Board of Directors declared a regular quarterly cash dividend on Plumas Bancorp common stock of $0.25 per share, payable February 15, 2023, to stockholders of record as of February 1, 2023. About Plumas Bancorp Plumas Bancorp is headquartered in Reno, Nevada. Plumas Bancorp’s principal subsidiary is Plumas Bank, which was founded in 1980. Plumas Ban

Yahoo | January 19, 2023

Plumas Bancorp Reports Record Earnings for the Fourth Quarter and Year Ended December 31, 2022

RENO, Nev., Jan. 18, 2023 (GLOBE NEWSWIRE) -- Plumas Bancorp (Nasdaq: PLBC), the parent company of Plumas Bank, today announced record earnings for the year and three months ended December 31, 2022. For the twelve months ended December 31, 2022, the Company reported net income of $26.4 million or $4.53 per share, an increase of $5.4 million, or 26% from $21.0 million or $3.82 per share earned during 2021. Earnings per diluted share increased to $4.47 during the twelve months ended December 31, 2

Yahoo | January 18, 2023

Read More 'PLBC' Stories Here

PLBC Price Returns

1-mo -22.83%
3-mo -4.95%
6-mo 14.66%
1-year -12.43%
3-year 103.68%
5-year 49.89%
YTD -9.29%
2022 11.73%
2021 46.54%
2020 -9.29%
2019 18.43%
2018 -0.79%

PLBC Dividends

Ex-Dividend Date Type Payout Amount Change
Loading, please wait...
View Full PLBC Dividend History

Get Free Updates

Join thousands of investors who get the latest news, insights and top rated picks from StockNews.com!


Page generated in 0.7688 seconds.