Pool Corp. (POOL): Price and Financial Metrics
POOL Price/Volume Stats
Current price | $346.91 | 52-week high | $423.97 |
Prev. close | $343.70 | 52-week low | $278.10 |
Day low | $341.92 | Volume | 272,700 |
Day high | $348.49 | Avg. volume | 413,104 |
50-day MA | $363.41 | Dividend yield | 1.27% |
200-day MA | $350.49 | Market Cap | 13.55B |
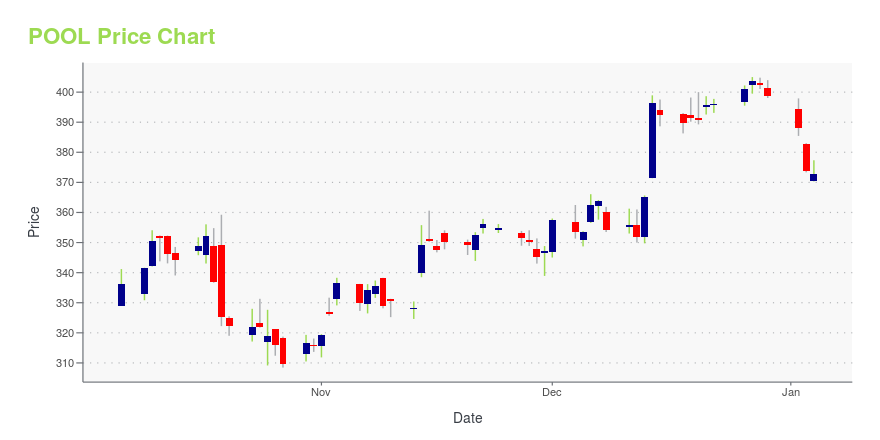
POOL Stock Price Chart Interactive Chart >
POOL POWR Grades
- POOL scores best on the Momentum dimension, with a Momentum rank ahead of 96.71% of US stocks.
- The strongest trend for POOL is in Stability, which has been heading up over the past 177 days.
- POOL ranks lowest in Sentiment; there it ranks in the 9th percentile.
POOL Stock Summary
- POOL has a higher market value than 87.2% of US stocks; more precisely, its current market capitalization is $13,422,162,433.
- Of note is the ratio of POOL CORP's sales and general administrative expense to its total operating expenses; 87.01% of US stocks have a lower such ratio.
- The volatility of POOL CORP's share price is greater than that of merely 12.46% US stocks with at least 200 days of trading history.
- If you're looking for stocks that are quantitatively similar to POOL CORP, a group of peers worth examining would be AOS, BBY, SITE, CHRW, and WBA.
- Visit POOL's SEC page to see the company's official filings. To visit the company's web site, go to www.poolcorp.com.
POOL Valuation Summary
- POOL's price/earnings ratio is 22.8; this is 22.58% higher than that of the median Industrials stock.
- Over the past 243 months, POOL's EV/EBIT ratio has gone up 5.2.
Below are key valuation metrics over time for POOL.
Stock | Date | P/S | P/B | P/E | EV/EBIT |
---|---|---|---|---|---|
POOL | 2023-09-19 | 2.4 | 9.3 | 22.8 | 19.1 |
POOL | 2023-09-18 | 2.3 | 9.3 | 22.7 | 19.1 |
POOL | 2023-09-15 | 2.4 | 9.4 | 22.9 | 19.2 |
POOL | 2023-09-14 | 2.4 | 9.5 | 23.2 | 19.4 |
POOL | 2023-09-13 | 2.4 | 9.3 | 22.9 | 19.2 |
POOL | 2023-09-12 | 2.4 | 9.3 | 22.8 | 19.1 |
POOL Growth Metrics
- The 2 year price growth rate now stands at 97.33%.
- Its 5 year net income to common stockholders growth rate is now at 67.79%.
- Its 4 year net income to common stockholders growth rate is now at 67.79%.

The table below shows POOL's growth in key financial areas (numbers in millions of US dollars).
Date | Revenue | Operating Cash Flow | Net Income to Common Stock |
---|---|---|---|
2022-09-30 | 6,119.364 | 261.895 | 784.208 |
2022-06-30 | 5,915.473 | 154.993 | 778.818 |
2022-03-31 | 5,647.488 | 28.268 | 731.23 |
2021-12-31 | 5,295.584 | 313.49 | 650.624 |
2021-09-30 | 5,099.287 | 367.732 | 602.188 |
2021-06-30 | 4,827.068 | 363.609 | 536.621 |
POOL's Quality Factors
The “Quality” component of the POWR Ratings focuses on 31 different factors of a companies fundamentals and operational strength. Here are some key insights as we drill into the specifics of these quality attributes.- POOL has a Quality Grade of B, ranking ahead of 90.56% of graded US stocks.
- POOL's asset turnover comes in at 2.435 -- ranking 24th of 105 Wholesale stocks.
- WLFC, FSTR, and AE are the stocks whose asset turnover ratios are most correlated with POOL.
The table below shows POOL's key quality metrics over time.
Period | Asset Turnover | Gross Margin | ROIC |
---|---|---|---|
2021-09-30 | 2.435 | 0.301 | 0.454 |
2021-06-30 | 2.513 | 0.294 | 0.429 |
2021-03-31 | 2.426 | 0.288 | 0.364 |
2020-12-31 | 2.340 | 0.287 | 0.300 |
2020-09-30 | 2.274 | 0.286 | 0.267 |
2020-06-30 | 2.160 | 0.286 | 0.226 |
POOL Price Target
For more insight on analysts targets of POOL, see our POOL price target page. And for a list of of all stocks sorted by upside potential based on analyst target price, see our Top Price Target page.
Average Price Target | $511.38 | Average Broker Recommendation | 1.65 (Moderate Buy) |
Pool Corp. (POOL) Company Bio
POOLCORP is the world's leading wholesale distributor of swimming pool equipment, parts and supplies, and related outdoor living products. The company operates over 410 locations worldwide with more than 5,500 employees through three primary distribution networks: SCP Distributors LLC, Superior Pool Products LLC, and Horizon Distributors Inc. Our Sales Centers each operate with full profit and loss responsibility, giving our organization an entrepreneurial spirit. (Source:Wikipedia)
Latest POOL News From Around the Web
Below are the latest news stories about POOL CORP that investors may wish to consider to help them evaluate POOL as an investment opportunity.
Pool Corporation to Present at the Jefferies Industrials ConferenceCOVINGTON, La., Aug. 31, 2023 (GLOBE NEWSWIRE) -- Pool Corporation (Nasdaq:POOL) announced today that Peter D. Arvan, President and Chief Executive Officer, and Melanie M. Hart, Vice President and Chief Financial Officer, will be participating in the Jefferies Industrials Conference at The Marriott Marquis in New York City, NY. They will be giving a presentation on Thursday, September 7, 2023, at 9:30 AM Eastern Time. The presentation materials used during the conference will be posted on the In |
Unveiling Pool (POOL)'s Value: Is It Really Priced Right? A Comprehensive GuideAn in-depth analysis of Pool Corp's intrinsic value, financial strength, and growth prospects |
What Makes Pool Corporation (POOL) a Prospective Investment?Aristotle Capital Boston, LLC, an investment advisor, released its “Small/Mid Cap Equity Strategy” second quarter 2023 investor letter. A copy of the same can be downloaded here. In the second quarter, Aristotle Small/Mid Cap Equity Composite delivered a return of 1.04% net of fees (1.18% gross of fees), trailing the Russell 2500 Index’s 5.22% total return. Security […] |
Pool Corporation's (NASDAQ:POOL) Fundamentals Look Pretty Strong: Could The Market Be Wrong About The Stock?With its stock down 6.2% over the past week, it is easy to disregard Pool (NASDAQ:POOL). However, a closer look at its... |
Bear of the Day: Pool Corp (POOL)Investors should wait until the water is warm for this pool stock. |
POOL Price Returns
1-mo | -2.00% |
3-mo | -6.00% |
6-mo | 4.15% |
1-year | 12.58% |
3-year | 13.20% |
5-year | 120.34% |
YTD | 15.78% |
2022 | -46.03% |
2021 | 52.98% |
2020 | 76.95% |
2019 | 44.50% |
2018 | 15.97% |
POOL Dividends
Ex-Dividend Date | Type | Payout Amount | Change | ||||||
---|---|---|---|---|---|---|---|---|---|
Loading, please wait... |
Continue Researching POOL
Want to see what other sources are saying about Pool Corp's financials and stock price? Try the links below:Pool Corp (POOL) Stock Price | Nasdaq
Pool Corp (POOL) Stock Quote, History and News - Yahoo Finance
Pool Corp (POOL) Stock Price and Basic Information | MarketWatch
Loading social stream, please wait...