PriceSmart, Inc. (PSMT): Price and Financial Metrics
PSMT Price/Volume Stats
Current price | $74.74 | 52-week high | $79.55 |
Prev. close | $75.11 | 52-week low | $56.29 |
Day low | $74.11 | Volume | 11,537 |
Day high | $75.13 | Avg. volume | 116,574 |
50-day MA | $73.07 | Dividend yield | 1.29% |
200-day MA | $68.15 | Market Cap | 2.32B |
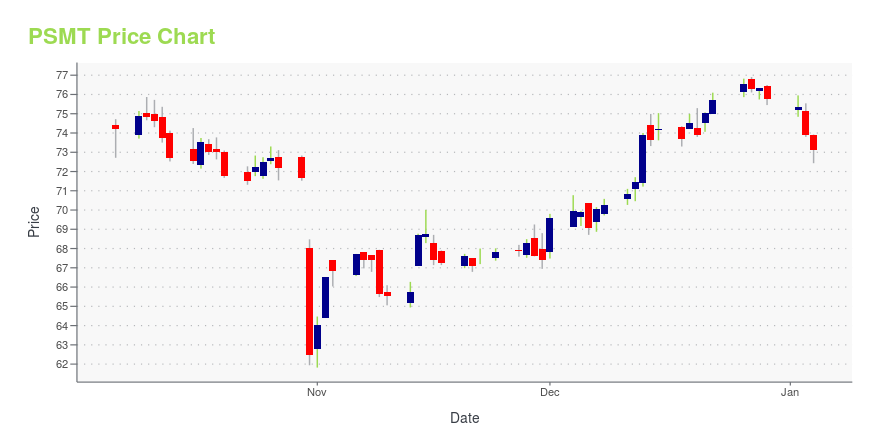
PSMT Stock Price Chart Interactive Chart >
PSMT POWR Grades
- Stability is the dimension where PSMT ranks best; there it ranks ahead of 95.07% of US stocks.
- PSMT's strongest trending metric is Growth; it's been moving up over the last 179 days.
- PSMT ranks lowest in Quality; there it ranks in the 62nd percentile.
PSMT Stock Summary
- The capital turnover (annual revenue relative to shareholder's equity) for PSMT is 4.07 -- better than 87.54% of US stocks.
- PSMT's one year PEG ratio, measuring expected growth in earnings next year relative to current common stock price is 320.16 -- higher than 92.31% of US-listed equities with positive expected earnings growth.
- Of note is the ratio of PRICESMART INC's sales and general administrative expense to its total operating expenses; 84.08% of US stocks have a lower such ratio.
- Stocks with similar financial metrics, market capitalization, and price volatility to PRICESMART INC are JBSS, ROCK, LRN, AYI, and MYE.
- PSMT's SEC filings can be seen here. And to visit PRICESMART INC's official web site, go to www.pricesmart.com.
PSMT Valuation Summary
- In comparison to the median Consumer Defensive stock, PSMT's price/earnings ratio is 0.23% higher, now standing at 21.5.
- PSMT's EV/EBIT ratio has moved up 2.6 over the prior 243 months.
Below are key valuation metrics over time for PSMT.
Stock | Date | P/S | P/B | P/E | EV/EBIT |
---|---|---|---|---|---|
PSMT | 2023-05-23 | 0.5 | 2.2 | 21.5 | 13.4 |
PSMT | 2023-05-22 | 0.5 | 2.2 | 21.4 | 13.3 |
PSMT | 2023-05-19 | 0.5 | 2.2 | 21.1 | 13.2 |
PSMT | 2023-05-18 | 0.5 | 2.2 | 21.0 | 13.1 |
PSMT | 2023-05-17 | 0.5 | 2.1 | 21.0 | 13.1 |
PSMT | 2023-05-16 | 0.5 | 2.1 | 20.6 | 12.8 |
PSMT Growth Metrics
- Its year over year cash and equivalents growth rate is now at 1.08%.
- The 3 year price growth rate now stands at 34.48%.
- Its year over year net income to common stockholders growth rate is now at 17.14%.

The table below shows PSMT's growth in key financial areas (numbers in millions of US dollars).
Date | Revenue | Operating Cash Flow | Net Income to Common Stock |
---|---|---|---|
2022-12-31 | 4,145.543 | 165.631 | 106.928 |
2022-09-30 | 4,066.093 | 121.829 | 104.534 |
2022-06-30 | 3,954.329 | 111.51 | 100.691 |
2022-03-31 | 3,818.783 | 89.519 | 103.962 |
2021-12-31 | 3,717.795 | 131.6 | 100.737 |
2021-09-30 | 3,619.871 | 127.166 | 97.963 |
PSMT's Quality Factors
The “Quality” component of the POWR Ratings focuses on 31 different factors of a companies fundamentals and operational strength. Here are some key insights as we drill into the specifics of these quality attributes.- PSMT has a Quality Grade of C, ranking ahead of 53.43% of graded US stocks.
- PSMT's asset turnover comes in at 2.178 -- ranking 38th of 165 Retail stocks.
- JWN, MUSA, and KSS are the stocks whose asset turnover ratios are most correlated with PSMT.
The table below shows PSMT's key quality metrics over time.
Period | Asset Turnover | Gross Margin | ROIC |
---|---|---|---|
2021-08-31 | 2.178 | 0.178 | 0.131 |
2021-05-31 | 2.135 | 0.177 | 0.134 |
2021-02-28 | 2.095 | 0.173 | 0.126 |
2020-11-30 | 2.119 | 0.169 | 0.122 |
2020-08-31 | 2.129 | 0.167 | 0.110 |
2020-05-31 | 2.253 | 0.166 | 0.118 |
PSMT Price Target
For more insight on analysts targets of PSMT, see our PSMT price target page. And for a list of of all stocks sorted by upside potential based on analyst target price, see our Top Price Target page.
Average Price Target | $103.00 | Average Broker Recommendation | 2 (Hold) |
PriceSmart, Inc. (PSMT) Company Bio
PriceSmart owns and operates membership shopping warehouse clubs in Latin American and the Caribbean. The company was founded in 1994 and is based in San Diego, California.
Latest PSMT News From Around the Web
Below are the latest news stories about PRICESMART INC that investors may wish to consider to help them evaluate PSMT as an investment opportunity.
PriceSmart (NASDAQ:PSMT) Will Pay A Larger Dividend Than Last Year At $0.46PriceSmart, Inc.'s ( NASDAQ:PSMT ) dividend will be increasing from last year's payment of the same period to $0.46 on... |
PriceSmart Announces Release of Its Comprehensive Environmental and Social Responsibility (ESR) Report for Fiscal Year 2022PriceSmart, Inc. (NASDAQ: PSMT) today announced the release of its Environmental and Social Responsibility (ESR) report for fiscal year 2022 (September 1, 2021 to August 31, 2022). PriceSmart's second annual ESR report illustrates the Company's continued dedication to sustainability, responsible corporate conduct, and transparency in its business in the United States and across the 12 countries and one U.S. territory in which the Company operates. |
PriceSmart Announces Opening of Third Warehouse Club in El Salvador and Earnings Release and Conference Call Details for the Third Quarter of Fiscal 2023PriceSmart, Inc. (NASDAQ: PSMT) today announced that on May 4, 2023 the Company opened its newest warehouse club in San Miguel, El Salvador, bringing the total number of warehouse clubs in operation by the Company to 51. The San Miguel club is the third club in El Salvador and was constructed on a five-acre property in the Hacienda San Andrés area, approximately 100 miles east of the capital city San Salvador. |
PriceSmart, Inc. (NASDAQ:PSMT) Shares Could Be 28% Above Their Intrinsic Value EstimateKey Insights The projected fair value for PriceSmart is US$57.03 based on 2 Stage Free Cash Flow to Equity Current... |
Declining Stock and Solid Fundamentals: Is The Market Wrong About PriceSmart, Inc. (NASDAQ:PSMT)?PriceSmart (NASDAQ:PSMT) has had a rough month with its share price down 9.8%. But if you pay close attention, you... |
PSMT Price Returns
1-mo | 6.01% |
3-mo | 10.50% |
6-mo | 14.20% |
1-year | -0.85% |
3-year | 32.00% |
5-year | -9.72% |
YTD | 23.75% |
2022 | -15.86% |
2021 | -19.06% |
2020 | 29.67% |
2019 | 21.59% |
2018 | -30.76% |
PSMT Dividends
Ex-Dividend Date | Type | Payout Amount | Change | ||||||
---|---|---|---|---|---|---|---|---|---|
Loading, please wait... |
Continue Researching PSMT
Want to do more research on Pricesmart Inc's stock and its price? Try the links below:Pricesmart Inc (PSMT) Stock Price | Nasdaq
Pricesmart Inc (PSMT) Stock Quote, History and News - Yahoo Finance
Pricesmart Inc (PSMT) Stock Price and Basic Information | MarketWatch
Loading social stream, please wait...