Phillips 66 (PSX): Price and Financial Metrics
GET POWR RATINGS... FREE!
PSX POWR Grades
- PSX scores best on the Momentum dimension, with a Momentum rank ahead of 98.24% of US stocks.
- The strongest trend for PSX is in Growth, which has been heading down over the past 177 days.
- PSX's current lowest rank is in the Stability metric (where it is better than 37.11% of US stocks).
PSX Stock Summary
- PSX has a higher market value than 95.06% of US stocks; more precisely, its current market capitalization is $46,355,767,451.
- With a price/sales ratio of 0.28, PHILLIPS 66 has a higher such ratio than just 6.73% of stocks in our set.
- In terms of twelve month growth in earnings before interest and taxes, PHILLIPS 66 is reporting a growth rate of -6,355.16%; that's higher than just 0.24% of US stocks.
- If you're looking for stocks that are quantitatively similar to PHILLIPS 66, a group of peers worth examining would be EBR, MOGO, MLVF, SGFY, and SOHO.
- PSX's SEC filings can be seen here. And to visit PHILLIPS 66's official web site, go to www.phillips66.com.
PSX Valuation Summary
- PSX's price/sales ratio is 0.3; this is 83.33% lower than that of the median Energy stock.
- PSX's price/earnings ratio has moved up 0.2 over the prior 131 months.
Below are key valuation metrics over time for PSX.
Stock | Date | P/S | P/B | P/E | EV/EBIT |
---|---|---|---|---|---|
PSX | 2023-01-13 | 0.3 | 1.7 | 4.7 | 4.5 |
PSX | 2023-01-12 | 0.3 | 1.7 | 4.7 | 4.5 |
PSX | 2023-01-11 | 0.3 | 1.7 | 4.6 | 4.4 |
PSX | 2023-01-10 | 0.3 | 1.7 | 4.6 | 4.4 |
PSX | 2023-01-09 | 0.3 | 1.7 | 4.6 | 4.5 |
PSX | 2023-01-06 | 0.3 | 1.8 | 4.8 | 4.6 |
PSX Growth Metrics
- Its 3 year net income to common stockholders growth rate is now at -51.6%.
- Its 2 year net cashflow from operations growth rate is now at 25.06%.
- Its 2 year net income to common stockholders growth rate is now at 578.99%.

The table below shows PSX's growth in key financial areas (numbers in millions of US dollars).
Date | Revenue | Operating Cash Flow | Net Income to Common Stock |
---|---|---|---|
2022-09-30 | 168,363 | 7,863 | 10,413 |
2022-06-30 | 151,071 | 6,922 | 5,424 |
2022-03-31 | 129,647 | 6,882 | 2,553 |
2021-12-31 | 114,852 | 6,017 | 1,317 |
2021-09-30 | 98,052 | 4,856 | -495 |
2021-06-30 | 82,879 | 3,144 | -1,696 |
PSX's Quality Factors
The “Quality” component of the POWR Ratings focuses on 31 different factors of a companies fundamentals and operational strength. Here are some key insights as we drill into the specifics of these quality attributes.- PSX has a Quality Grade of C, ranking ahead of 53.55% of graded US stocks.
- PSX's asset turnover comes in at 1.497 -- ranking 6th of 136 Petroleum and Natural Gas stocks.
- HFC, CVX, and TREC are the stocks whose asset turnover ratios are most correlated with PSX.
The table below shows PSX's key quality metrics over time.
Period | Asset Turnover | Gross Margin | ROIC |
---|---|---|---|
2021-06-30 | 1.497 | 0.033 | -0.037 |
2021-03-31 | 1.209 | 0.027 | -0.053 |
2020-12-31 | 1.207 | 0.042 | -0.087 |
2020-09-30 | 1.418 | 0.057 | -0.056 |
2020-06-30 | 1.594 | 0.071 | -0.014 |
2020-03-31 | 1.874 | 0.081 | 0.029 |
PSX Price Target
For more insight on analysts targets of PSX, see our PSX price target page. And for a list of of all stocks sorted by upside potential based on analyst target price, see our Top Price Target page.
Average Price Target | $88.88 | Average Broker Recommendation | 1.56 (Moderate Buy) |
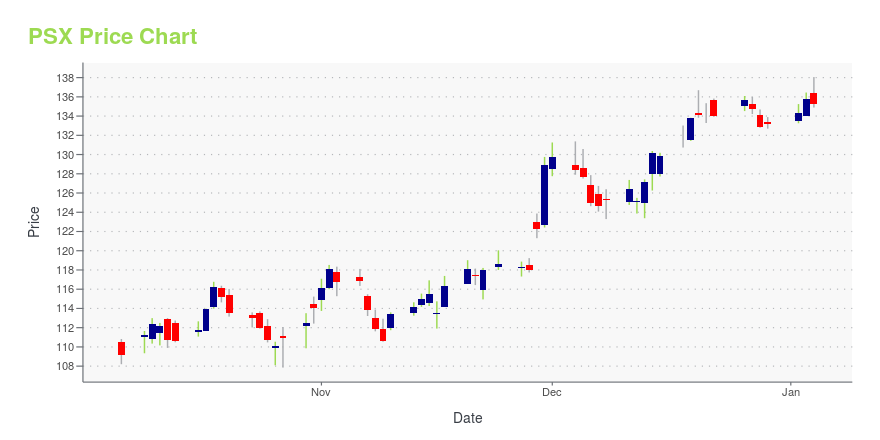
PSX Stock Price Chart Interactive Chart >
PSX Price/Volume Stats
Current price | $100.79 | 52-week high | $113.53 |
Prev. close | $98.08 | 52-week low | $73.85 |
Day low | $98.49 | Volume | 1,602,438 |
Day high | $101.55 | Avg. volume | 3,228,986 |
50-day MA | $103.52 | Dividend yield | 3.96% |
200-day MA | $95.12 | Market Cap | 47.64B |
Phillips 66 (PSX) Company Bio
The Phillips 66 Company is an American multinational energy company headquartered in Westchase, Houston, Texas. It debuted as an independent energy company when ConocoPhillips executed a spin-off of its downstream and midstream assets. Its name dating back to 1927 as a trademark of the Phillips Petroleum Company, the newly reconfigured Phillips 66 began trading on the New York Stock Exchange on May 1, 2012, under the ticker PSX. The company is engaged in producing natural gas liquids (NGL) and petrochemicals. The company has approximately 14,000 employees worldwide and is active in the United States, Australia, United Kingdom, Germany, Austria, and Switzerland. (Source:Wikipedia)
Latest PSX News From Around the Web
Below are the latest news stories about PHILLIPS 66 that investors may wish to consider to help them evaluate PSX as an investment opportunity.
Phillips 66: Despite Uncertainties, Dividend Growth Outlook Remains Very Strong |
Novonix: Graphite Production Delay May Be ProblematicNovonix Limited (NVX) (NVNXF) is an Australia-based battery technology company that’s also trying to become a synthetic graphite producer. It aims to become the first producer of North American-made synthetic graphite to supply the booming and strategically important Anode Material Market. The company has taken some major steps in that aim and has attracted a lot of attention in doing so. It has locked-down a sizeable investment from a key input supplier, signed an agreement with what will certainly become a maj... |
Murphy (MUSA) Q4 Earnings Falter on Light Petroleum SalesMurphy USA's (MUSA) total fuel contribution rose 20.1% year over year to $369.3 million due to margin expansion and higher volumes. |
5 Promising Price-to-Book Value Stocks to Buy in FebruaryThe P/B ratio helps to identify low-priced stocks that have high growth prospects. Deutsche Bank Aktiengesellschaft (DB), Signet Jewelers (SIG), Phillips 66 (PSX), Acco Brands Corporation (ACCO) and Sterling Infrastructure (STRL) are some such stocks. |
Bet On DuPont Analysis & Pick 5 Top StocksDo you have more faith in DuPont analysis than simple ROE calculation? Tap W.W Grainger (GWW), Olympic Steel (ZEUS), AllianceBernstein (AB), Valero Energy (VLO) and Phillips 66 (PSX). |
PSX Price Returns
1-mo | -4.65% |
3-mo | -2.32% |
6-mo | 16.37% |
1-year | 16.25% |
3-year | 28.23% |
5-year | 33.70% |
YTD | -3.16% |
2022 | 49.58% |
2021 | 8.51% |
2020 | -33.85% |
2019 | 33.97% |
2018 | -12.28% |
PSX Dividends
Ex-Dividend Date | Type | Payout Amount | Change | ||||||
---|---|---|---|---|---|---|---|---|---|
Loading, please wait... |
Continue Researching PSX
Want to see what other sources are saying about Phillips 66's financials and stock price? Try the links below:Phillips 66 (PSX) Stock Price | Nasdaq
Phillips 66 (PSX) Stock Quote, History and News - Yahoo Finance
Phillips 66 (PSX) Stock Price and Basic Information | MarketWatch
Loading social stream, please wait...