Patterson-UTI Energy, Inc. (PTEN): Price and Financial Metrics
GET POWR RATINGS... FREE!
PTEN POWR Grades
- PTEN scores best on the Momentum dimension, with a Momentum rank ahead of 99.98% of US stocks.
- The strongest trend for PTEN is in Growth, which has been heading up over the past 177 days.
- PTEN's current lowest rank is in the Stability metric (where it is better than 8.7% of US stocks).
PTEN Stock Summary
- PATTERSON UTI ENERGY INC's stock had its IPO on November 2, 1993, making it an older stock than 79.09% of US equities in our set.
- Of note is the ratio of PATTERSON UTI ENERGY INC's sales and general administrative expense to its total operating expenses; merely 4.43% of US stocks have a lower such ratio.
- Revenue growth over the past 12 months for PATTERSON UTI ENERGY INC comes in at 109.25%, a number that bests 92.49% of the US stocks we're tracking.
- If you're looking for stocks that are quantitatively similar to PATTERSON UTI ENERGY INC, a group of peers worth examining would be CGC, SNDR, GSAT, OBE, and SUNL.
- Visit PTEN's SEC page to see the company's official filings. To visit the company's web site, go to www.patenergy.com.
PTEN Valuation Summary
- PTEN's price/earnings ratio is -12.3; this is 230.85% lower than that of the median Energy stock.
- PTEN's EV/EBIT ratio has moved down 85.6 over the prior 243 months.
Below are key valuation metrics over time for PTEN.
Stock | Date | P/S | P/B | P/E | EV/EBIT |
---|---|---|---|---|---|
PTEN | 2023-01-13 | 1.6 | 2.3 | -12.3 | -17.2 |
PTEN | 2023-01-12 | 1.6 | 2.3 | -12.3 | -17.2 |
PTEN | 2023-01-11 | 1.6 | 2.3 | -12.1 | -17.0 |
PTEN | 2023-01-10 | 1.6 | 2.3 | -12.4 | -17.4 |
PTEN | 2023-01-09 | 1.6 | 2.3 | -12.1 | -17.0 |
PTEN | 2023-01-06 | 1.6 | 2.2 | -11.9 | -16.8 |
PTEN Growth Metrics
- The 5 year price growth rate now stands at -86.94%.
- Its 4 year net income to common stockholders growth rate is now at -166.89%.
- The 3 year net cashflow from operations growth rate now stands at -84.23%.

The table below shows PTEN's growth in key financial areas (numbers in millions of US dollars).
Date | Revenue | Operating Cash Flow | Net Income to Common Stock |
---|---|---|---|
2022-09-30 | 2,325.609 | 307.145 | -307.264 |
2022-06-30 | 1,955.991 | 136.316 | -451.714 |
2022-03-31 | 1,625.527 | 120.548 | -576.909 |
2021-12-31 | 1,357.081 | 95.496 | -654.545 |
2021-09-30 | 1,111.389 | 47.171 | -399.247 |
2021-06-30 | 960.645 | 103.722 | -428.36 |
PTEN's Quality Factors
The “Quality” component of the POWR Ratings focuses on 31 different factors of a companies fundamentals and operational strength. Here are some key insights as we drill into the specifics of these quality attributes.- PTEN has a Quality Grade of C, ranking ahead of 28.69% of graded US stocks.
- PTEN's asset turnover comes in at 0.354 -- ranking 75th of 137 Petroleum and Natural Gas stocks.
- WTTR, HAL, and PBF are the stocks whose asset turnover ratios are most correlated with PTEN.
The table below shows PTEN's key quality metrics over time.
Period | Asset Turnover | Gross Margin | ROIC |
---|---|---|---|
2021-09-30 | 0.354 | 0.250 | -0.124 |
2021-06-30 | 0.295 | 0.280 | -0.127 |
2021-03-31 | 0.271 | 0.323 | -0.135 |
2020-12-31 | 0.315 | 0.324 | -0.223 |
2020-09-30 | 0.362 | 0.320 | -0.203 |
2020-06-30 | 0.432 | 0.308 | -0.239 |
PTEN Price Target
For more insight on analysts targets of PTEN, see our PTEN price target page. And for a list of of all stocks sorted by upside potential based on analyst target price, see our Top Price Target page.
Average Price Target | $9.71 | Average Broker Recommendation | 1.88 (Hold) |
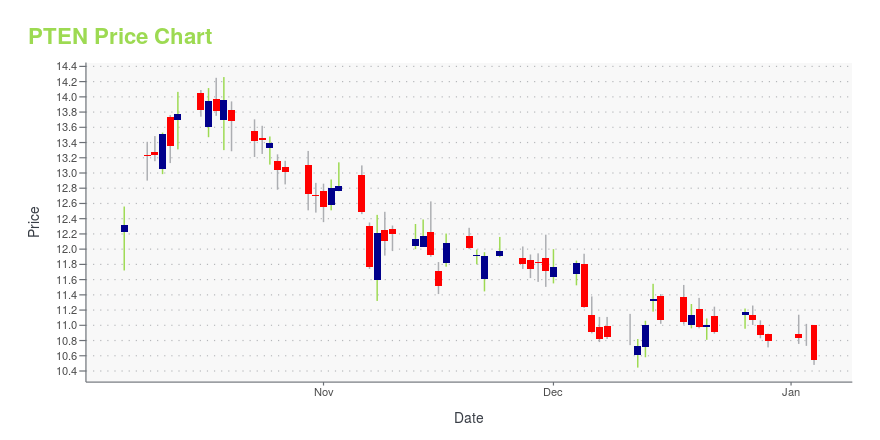
PTEN Stock Price Chart Interactive Chart >
PTEN Price/Volume Stats
Current price | $16.23 | 52-week high | $20.53 |
Prev. close | $16.00 | 52-week low | $10.29 |
Day low | $15.90 | Volume | 3,201,226 |
Day high | $16.47 | Avg. volume | 2,748,920 |
50-day MA | $16.63 | Dividend yield | 2% |
200-day MA | $15.88 | Market Cap | 3.52B |
Patterson-UTI Energy, Inc. (PTEN) Company Bio
Patterson-UTI Energy provides onshore contract drilling and pressure pumping services to exploration and production companies in North America. The company was founded in 1978 and is based in Houston, Texas.
Latest PTEN News From Around the Web
Below are the latest news stories about PATTERSON UTI ENERGY INC that investors may wish to consider to help them evaluate PTEN as an investment opportunity.
Core Laboratories (CLB) Q4 Earnings Beat, Revenues MissCore Labs' (CLB) revenues for the first quarter of 2023 are anticipated in the $125-$129 million range, while the operating income is estimated in the $11.5-$14.5 million band. |
Transocean (RIG) Wins 910-Day Drilling Deal Set to Start in Q3Transocean (RIG) lands 910-day contract for Dhirubhai Deepwater KG2 in Brazil. |
TechnipFMC (FTI) Wins Upto $1B iEPCI Contract From Aker BPTechnipFMC's (FTI) iEPCI contract from Aker BP involves the engineering, procurement, construction, and installation of subsea production systems, controls, pipelines and umbilicals. |
Patterson-UTI's (PTEN) Q4 Earnings: Another Beat in the Cards?Higher revenues from the Contract Drilling and Pressure Pumping segments are likely to have boosted Patterson-UTI Energy's (PTEN) fourth-quarter results. |
Patterson-UTI Reports Drilling Activity for January 2023PATTERSON-UTI ENERGY, INC.(NASDAQ:PTEN) today reported that for the month of January 2023, the Company had an average of 130 drilling rigs operating in the United States. |
PTEN Price Returns
1-mo | -3.85% |
3-mo | -9.12% |
6-mo | 7.07% |
1-year | 52.41% |
3-year | 129.89% |
5-year | -7.10% |
YTD | -3.62% |
2022 | 101.74% |
2021 | 62.31% |
2020 | -48.80% |
2019 | 3.07% |
2018 | -54.64% |
PTEN Dividends
Ex-Dividend Date | Type | Payout Amount | Change | ||||||
---|---|---|---|---|---|---|---|---|---|
Loading, please wait... |
Continue Researching PTEN
Here are a few links from around the web to help you further your research on Patterson Uti Energy Inc's stock as an investment opportunity:Patterson Uti Energy Inc (PTEN) Stock Price | Nasdaq
Patterson Uti Energy Inc (PTEN) Stock Quote, History and News - Yahoo Finance
Patterson Uti Energy Inc (PTEN) Stock Price and Basic Information | MarketWatch
Loading social stream, please wait...