Protagonist Therapeutics, Inc. (PTGX): Price and Financial Metrics
GET POWR RATINGS... FREE!
PTGX POWR Grades
- Sentiment is the dimension where PTGX ranks best; there it ranks ahead of 66.39% of US stocks.
- PTGX's strongest trending metric is Growth; it's been moving up over the last 178 days.
- PTGX ranks lowest in Stability; there it ranks in the 1st percentile.
PTGX Stock Summary
- The ratio of debt to operating expenses for PROTAGONIST THERAPEUTICS INC is higher than it is for about only 7.1% of US stocks.
- With a price/sales ratio of 43.25, PROTAGONIST THERAPEUTICS INC has a higher such ratio than 96.06% of stocks in our set.
- With a year-over-year growth in debt of -37.59%, PROTAGONIST THERAPEUTICS INC's debt growth rate surpasses just 7.94% of about US stocks.
- If you're looking for stocks that are quantitatively similar to PROTAGONIST THERAPEUTICS INC, a group of peers worth examining would be RNA, ATRA, QURE, ARVN, and FATE.
- Visit PTGX's SEC page to see the company's official filings. To visit the company's web site, go to www.protagonist-inc.com.
PTGX Valuation Summary
- In comparison to the median Healthcare stock, PTGX's EV/EBIT ratio is 223.66% lower, now standing at -8.1.
- PTGX's price/sales ratio has moved NA NA over the prior 80 months.
Below are key valuation metrics over time for PTGX.
Stock | Date | P/S | P/B | P/E | EV/EBIT |
---|---|---|---|---|---|
PTGX | 2023-03-17 | 43.2 | 5.3 | -9.0 | -8.1 |
PTGX | 2023-03-16 | 44.7 | 5.5 | -9.3 | -8.4 |
PTGX | 2023-03-15 | 46.4 | 5.7 | -9.7 | -8.7 |
PTGX | 2023-03-14 | 35.3 | 5.1 | -9.6 | -8.4 |
PTGX | 2023-03-13 | 35.5 | 5.1 | -9.6 | -8.5 |
PTGX | 2023-03-10 | 34.9 | 5.0 | -9.5 | -8.3 |
PTGX Growth Metrics
- Its 4 year net cashflow from operations growth rate is now at -16.03%.
- Its 3 year cash and equivalents growth rate is now at 40.51%.
- Its 2 year cash and equivalents growth rate is now at 63.52%.

The table below shows PTGX's growth in key financial areas (numbers in millions of US dollars).
Date | Revenue | Operating Cash Flow | Net Income to Common Stock |
---|---|---|---|
2022-09-30 | 35.198 | -103.441 | -130.106 |
2022-06-30 | 45.484 | -106.71 | -132.678 |
2022-03-31 | 46.89 | -116.775 | -122.483 |
2021-12-31 | 27.357 | -107.865 | -125.551 |
2021-09-30 | 24.39 | -99.793 | -107.53 |
2021-06-30 | 27.218 | -87.61 | -81.489 |
PTGX's Quality Factors
The “Quality” component of the POWR Ratings focuses on 31 different factors of a companies fundamentals and operational strength. Here are some key insights as we drill into the specifics of these quality attributes.- PTGX has a Quality Grade of D, ranking ahead of 12.65% of graded US stocks.
- PTGX's asset turnover comes in at 0.07 -- ranking 291st of 682 Pharmaceutical Products stocks.
- RGNX, MBIO, and MTEM are the stocks whose asset turnover ratios are most correlated with PTGX.
The table below shows PTGX's key quality metrics over time.
Period | Asset Turnover | Gross Margin | ROIC |
---|---|---|---|
2021-09-30 | 0.070 | 1 | -0.571 |
2021-06-30 | 0.088 | 1 | -0.513 |
2021-03-31 | 0.117 | 1 | -0.538 |
2020-12-31 | 0.127 | 1 | -0.678 |
2020-09-30 | 0.140 | 1 | -0.800 |
2020-06-30 | 0.100 | 1 | -0.977 |
PTGX Price Target
For more insight on analysts targets of PTGX, see our PTGX price target page. And for a list of of all stocks sorted by upside potential based on analyst target price, see our Top Price Target page.
Average Price Target | $31.75 | Average Broker Recommendation | 1.44 (Moderate Buy) |
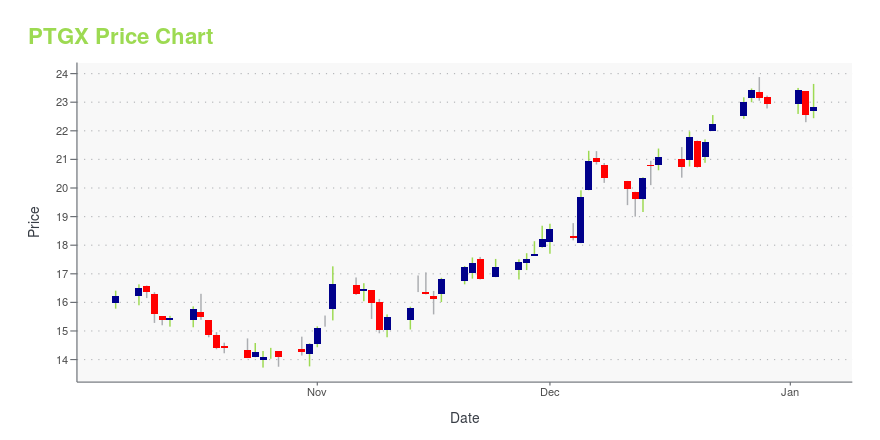
PTGX Stock Price Chart Interactive Chart >
PTGX Price/Volume Stats
Current price | $22.78 | 52-week high | $27.31 |
Prev. close | $22.42 | 52-week low | $6.91 |
Day low | $22.30 | Volume | 1,147,600 |
Day high | $23.65 | Avg. volume | 1,783,213 |
50-day MA | $16.24 | Dividend yield | N/A |
200-day MA | $10.74 | Market Cap | 1.17B |
Protagonist Therapeutics, Inc. (PTGX) Company Bio
Protagonist Therapeutics, Inc., a clinical-stage biopharmaceutical company, focuses on discovering and developing peptide-based new chemical entities to address significant unmet medical needs. The company was founded in 2006 and is based in Milpitas, California.
Latest PTGX News From Around the Web
Below are the latest news stories about PROTAGONIST THERAPEUTICS INC that investors may wish to consider to help them evaluate PTGX as an investment opportunity.
Analysts Just Made A Major Revision To Their Protagonist Therapeutics, Inc. (NASDAQ:PTGX) Revenue ForecastsOne thing we could say about the analysts on Protagonist Therapeutics, Inc. ( NASDAQ:PTGX ) - they aren't optimistic... |
Protagonist Therapeutics (NASDAQ:PTGX) Is In A Good Position To Deliver On Growth PlansThere's no doubt that money can be made by owning shares of unprofitable businesses. For example, biotech and mining... |
Protagonist Therapeutics Reports Fourth Quarter and Full Year 2022 Financial Results and Provides Corporate UpdateProtagonist Therapeutics (Nasdaq:PTGX) ("Protagonist" or "the Company") today reported financial results for the fourth quarter and full year ended December 31, 2022 and provided a corporate update. |
Protagonist Therapeutics Touts Positive Data From Bone Marrow Disorder StudyProtagonist Therapeutics Inc (NASDAQ: PTGX) announced topline results from the blinded, placebo-controlled, randomized withdrawal portion of REVIVE of rusfertide for polycythemia vera, causing the bone marrow to make too many red blood cells. Subjects receiving rusfertide achieved highly statistically significant improvements versus placebo in the primary endpoint. More subjects receiving rusfertide during the blinded randomized withdrawal portion of the REVIVE study were responders compared wit |
Protagonist Therapeutics Announces Highly Statistically Significant Results from the Randomized Withdrawal Portion of the REVIVE Study of Rusfertide in Polycythemia VeraProtagonist Therapeutics, Inc. (NASDAQ:PTGX) ("Protagonist" or "the Company"), today announced positive topline results from the blinded, placebo-controlled, randomized withdrawal portion of REVIVE, a study evaluating rusfertide, a subcutaneous injectable hepcidin mimetic, in patients with polycythemia vera (PV). |
PTGX Price Returns
1-mo | 40.88% |
3-mo | 133.16% |
6-mo | 172.49% |
1-year | -9.82% |
3-year | 303.19% |
5-year | 15.46% |
YTD | 108.80% |
2022 | -68.10% |
2021 | 69.64% |
2020 | 185.96% |
2019 | 4.75% |
2018 | -67.64% |
Loading social stream, please wait...