
Petroneft Resources PLC (PTR): Price and Financial Metrics
PTR Price/Volume Stats
| Current price | $46.85 | 52-week high | $57.87 |
| Prev. close | $47.09 | 52-week low | $41.48 |
| Day low | $46.30 | Volume | 183,100 |
| Day high | $47.13 | Avg. volume | 217,309 |
| 50-day MA | $45.55 | Dividend yield | 5.45% |
| 200-day MA | $48.57 | Market Cap | 85.75B |
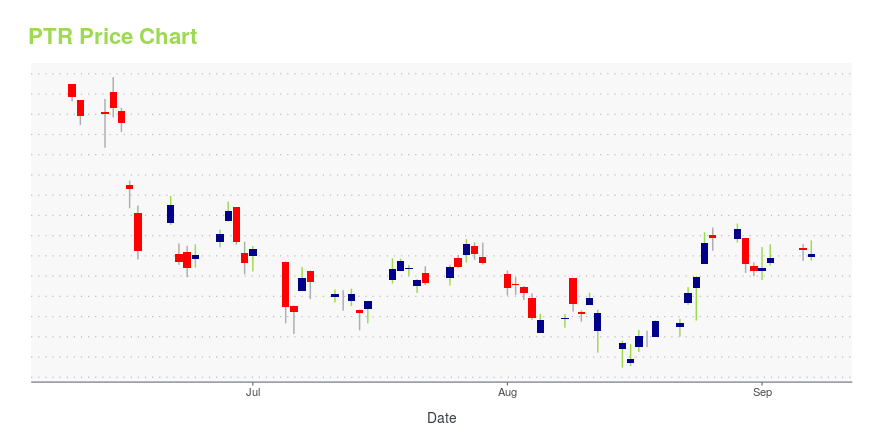
PTR Stock Price Chart Interactive Chart >
Petroneft Resources PLC (PTR) Company Bio
PetroNeft Resources plc is an international oil and gas exploration and production company, focused on Russia. The company’s shares are listed on the London AIM and Dublin ESM Markets. (Source:Petroneft)
Latest PTR News From Around the Web
Below are the latest news stories about PETROCHINA CO LTD that investors may wish to consider to help them evaluate PTR as an investment opportunity.
PetroChina (PTR) 1H Earnings Surge on Soaring Fuel PricesPetroChina's (PTR) total production of oil and natural gas increased 3.1% year over year to 845 million barrels of oil equivalent. |
UPDATE 2-Russia's Gazprom, CNPC agree to use rouble, yuan for gas payments - GazpromState energy giants Gazprom and China National Petroleum Corporation (CNPC) signed several agreements on Tuesday, including on the use Russian roubles and Chinese yuan to pay for Russian natural gas supplies to China, Gazprom said. The agreements were in addition to a February deal between them to increase gas supplies from 2023 via the eastern route of a China-Russia pipeline, bolstering an energy alliance at a time of strained ties between Russia and the West over Ukraine and other issues. |
Chinese companies listed on U.S. exchanges must finally open their booksThe agreement avoids immediate delisting of Chinese firms, but enforcement of the law to protect investors and national security won't be easy |
China’s Oil Majors Post Record Profits on Surging Fuel Prices(Bloomberg) -- Covid lockdowns, a property market crisis and a struggling domestic economy weren’t enough to slow down China’s oil giants as they posted record first half profits.Most Read from BloombergPowell Heaps Pressure on Risk Sentiment as More Catalysts Loom‘Inflation Fever’ Is Finally Breaking — But Central Banks Won’t Stop Hiking RatesSingapore Unveils Long-Term Work Visas to End Talent CrunchPowell’s 8-Minute Speech Erases $78 Billion From Richest AmericansTech Leads Declines as Trader |
Oil Posts Weekly Gain as Saudi Warning Lingers Over Market(Bloomberg) -- Oil rose this week with Saudi Arabia’s warning that supply cuts may be warranted overshadowing multiple bearish developments.Most Read from BloombergPowell’s 8-Minute Speech Erases $78 Billion From Richest AmericansTop Central Bankers Deliver Hawkish Message at Jackson HoleAir France Pilots Suspended After In-Flight Cockpit BrawlStocks Face Another Sharp Slide After Powell’s Hawkish PivotTrump’s Stash at Mar-a-Lago Included Highly Classified DocumentsWest Texas Intermediate future |
PTR Price Returns
| 1-mo | N/A |
| 3-mo | N/A |
| 6-mo | N/A |
| 1-year | N/A |
| 3-year | 27.10% |
| 5-year | 12.82% |
| YTD | N/A |
| 2023 | N/A |
| 2022 | 0.00% |
| 2021 | 53.73% |
| 2020 | -32.79% |
| 2019 | -14.90% |
PTR Dividends
| Ex-Dividend Date | Type | Payout Amount | Change | ||||||
|---|---|---|---|---|---|---|---|---|---|
| Loading, please wait... | |||||||||
Continue Researching PTR
Want to see what other sources are saying about Petrochina Co Ltd's financials and stock price? Try the links below:Petrochina Co Ltd (PTR) Stock Price | Nasdaq
Petrochina Co Ltd (PTR) Stock Quote, History and News - Yahoo Finance
Petrochina Co Ltd (PTR) Stock Price and Basic Information | MarketWatch
Loading social stream, please wait...