Papa John's International, Inc. (PZZA): Price and Financial Metrics
PZZA Price/Volume Stats
Current price | $68.44 | 52-week high | $97.78 |
Prev. close | $68.28 | 52-week low | $66.74 |
Day low | $67.53 | Volume | 781,100 |
Day high | $68.84 | Avg. volume | 681,421 |
50-day MA | $77.81 | Dividend yield | 2.66% |
200-day MA | $79.16 | Market Cap | 2.24B |
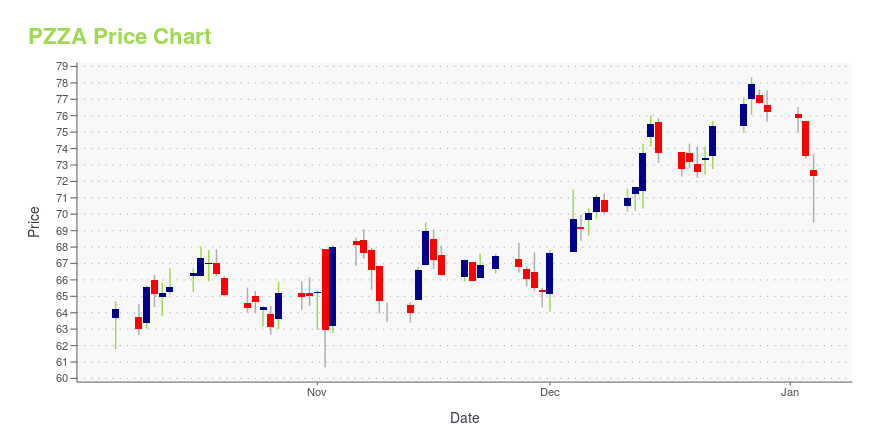
PZZA Stock Price Chart Interactive Chart >
PZZA POWR Grades
- Growth is the dimension where PZZA ranks best; there it ranks ahead of 80.89% of US stocks.
- PZZA's strongest trending metric is Quality; it's been moving up over the last 177 days.
- PZZA's current lowest rank is in the Sentiment metric (where it is better than 12.71% of US stocks).
PZZA Stock Summary
- PAPA JOHNS INTERNATIONAL INC's capital turnover -- a measure of revenue relative to shareholder's equity -- is better than only 3.23% of US listed stocks.
- Of note is the ratio of PAPA JOHNS INTERNATIONAL INC's sales and general administrative expense to its total operating expenses; just 16.53% of US stocks have a lower such ratio.
- Equity multiplier, or assets relative to shareholders' equity, comes in at -2.24 for PAPA JOHNS INTERNATIONAL INC; that's greater than it is for only 4.66% of US stocks.
- If you're looking for stocks that are quantitatively similar to PAPA JOHNS INTERNATIONAL INC, a group of peers worth examining would be DEI, NDAQ, CWST, NAPA, and UTZ.
- Visit PZZA's SEC page to see the company's official filings. To visit the company's web site, go to www.papajohns.com.
PZZA Valuation Summary
- PZZA's price/earnings ratio is 35.4; this is 136% higher than that of the median Consumer Cyclical stock.
- Over the past 243 months, PZZA's price/sales ratio has gone up 0.7.
Below are key valuation metrics over time for PZZA.
Stock | Date | P/S | P/B | P/E | EV/EBIT |
---|---|---|---|---|---|
PZZA | 2023-09-13 | 1.2 | -5.3 | 35.4 | 27.4 |
PZZA | 2023-09-12 | 1.2 | -5.2 | 35.0 | 27.2 |
PZZA | 2023-09-11 | 1.2 | -5.2 | 35.1 | 27.2 |
PZZA | 2023-09-08 | 1.2 | -5.2 | 34.9 | 27.1 |
PZZA | 2023-09-07 | 1.2 | -5.3 | 35.2 | 27.3 |
PZZA | 2023-09-06 | 1.2 | -5.1 | 34.2 | 26.7 |
PZZA Growth Metrics
- The 4 year revenue growth rate now stands at -5.97%.
- The 2 year price growth rate now stands at 17.09%.
- Its 2 year net income to common stockholders growth rate is now at -1504.12%.

The table below shows PZZA's growth in key financial areas (numbers in millions of US dollars).
Date | Revenue | Operating Cash Flow | Net Income to Common Stock |
---|---|---|---|
2022-09-30 | 2,104.754 | 67.604 | 68.415 |
2022-06-30 | 2,107.024 | 102.23 | 89.131 |
2022-03-31 | 2,099.367 | 146.852 | -16.007 |
2021-12-31 | 2,068.421 | 184.675 | 4.073 |
2021-09-30 | 2,009.347 | 211.516 | -14.497 |
2021-06-30 | 1,969.506 | 226.811 | -32.001 |
PZZA's Quality Factors
The “Quality” component of the POWR Ratings focuses on 31 different factors of a companies fundamentals and operational strength. Here are some key insights as we drill into the specifics of these quality attributes.- PZZA has a Quality Grade of B, ranking ahead of 85.37% of graded US stocks.
- PZZA's asset turnover comes in at 2.273 -- ranking 1st of 79 Restaraunts Hotels Motels stocks.
- CMG, PBPB, and PENN are the stocks whose asset turnover ratios are most correlated with PZZA.
The table below shows PZZA's key quality metrics over time.
Period | Asset Turnover | Gross Margin | ROIC |
---|---|---|---|
2021-09-26 | 2.273 | 0.357 | 0.156 |
2021-06-27 | 2.275 | 0.353 | 0.149 |
2021-03-28 | 2.276 | 0.348 | 0.137 |
2020-12-27 | 2.291 | 0.341 | 0.103 |
2020-09-27 | 2.330 | 0.340 | 0.077 |
2020-06-28 | 2.304 | 0.333 | 0.054 |
PZZA Price Target
For more insight on analysts targets of PZZA, see our PZZA price target page. And for a list of of all stocks sorted by upside potential based on analyst target price, see our Top Price Target page.
Average Price Target | $129.12 | Average Broker Recommendation | 1.38 (Strong Buy) |
Papa John's International, Inc. (PZZA) Company Bio
Papa John's operates and franchises pizza delivery and carryout restaurants under the trademark Papa Johns in the United States and internationally. The company was founded in 1985 and is based in Louisville, Kentucky.
Latest PZZA News From Around the Web
Below are the latest news stories about PAPA JOHNS INTERNATIONAL INC that investors may wish to consider to help them evaluate PZZA as an investment opportunity.
Papa Johns Announces Executive AppointmentsATLANTA, September 13, 2023--Today, Papa John’s International, Inc. (NASDAQ: PZZA) ("Papa Johns" or "Company") announced updates to its executive leadership team. Amanda Clark will transition from her role as Chief International and Development Officer to become Chief Operating Officer, International, focusing on the operations and development of the Papa Johns footprint in international markets. Chief Restaurant Officer Joe Sieve will assume North American development responsibilities. He will |
Unveiling Papa John's International (PZZA)'s Value: Is It Really Priced Right? A Comprehensive GuideDiscovering the intrinsic value of Papa John's International (PZZA) and its potential for value investors |
Papa John’s Stock Should Not Trade At A Discount To Peers – Analyst SaysWedbush Securities upgrades Papa John's International Inc to "outperform". Analyst Nick Setyan sees same-store sales and margin improvement ahead. Papa John's stock is currently down more than 20% versus its YTD high. |
Blackstone and Airbnb Set to Join S&P 500; Others to Join S&P 100, S&P MidCap 400 and S&P SmallCap 600S&P Dow Jones Indices ("S&P DJI") will make the following changes to the S&P 500, S&P 100, S&P MidCap 400 and S&P SmallCap 600 indices effective prior to the open of trading on Monday, September 18, to coincide with the quarterly rebalance. The changes ensure each index is more representative of its market capitalization range. All companies being added to the S&P MidCap 400 are more representative of the mid-cap market space, and all companies being added to the S&P SmallCap 600 are more repres |
MercadoLibre upgraded, PagerDuty downgraded: Wall Street's top analyst callsMercadoLibre upgraded, PagerDuty downgraded: Wall Street's top analyst calls |
PZZA Price Returns
1-mo | -11.59% |
3-mo | -6.78% |
6-mo | -7.65% |
1-year | -2.60% |
3-year | -16.51% |
5-year | 43.97% |
YTD | -15.56% |
2022 | -37.26% |
2021 | 58.87% |
2020 | 35.88% |
2019 | 61.50% |
2018 | -27.80% |
PZZA Dividends
Ex-Dividend Date | Type | Payout Amount | Change | ||||||
---|---|---|---|---|---|---|---|---|---|
Loading, please wait... |
Continue Researching PZZA
Want to do more research on Papa Johns International Inc's stock and its price? Try the links below:Papa Johns International Inc (PZZA) Stock Price | Nasdaq
Papa Johns International Inc (PZZA) Stock Quote, History and News - Yahoo Finance
Papa Johns International Inc (PZZA) Stock Price and Basic Information | MarketWatch
Loading social stream, please wait...