Qualcomm Inc. (QCOM): Price and Financial Metrics
QCOM Price/Volume Stats
Current price | $166.92 | 52-week high | $177.59 |
Prev. close | $167.20 | 52-week low | $101.47 |
Day low | $166.35 | Volume | 6,653,600 |
Day high | $171.46 | Avg. volume | 9,420,832 |
50-day MA | $153.35 | Dividend yield | 1.9% |
200-day MA | $128.38 | Market Cap | 186.28B |
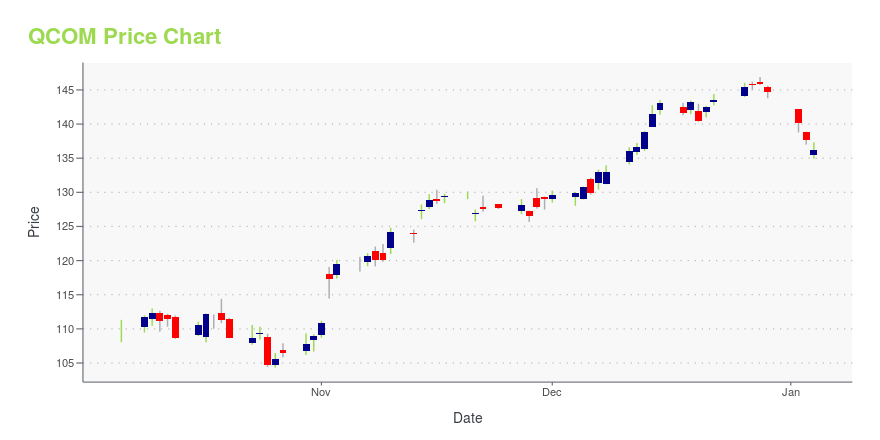
QCOM Stock Price Chart Interactive Chart >
QCOM POWR Grades
- QCOM scores best on the Quality dimension, with a Quality rank ahead of 92.1% of US stocks.
- The strongest trend for QCOM is in Growth, which has been heading up over the past 26 weeks.
- QCOM's current lowest rank is in the Growth metric (where it is better than 16.92% of US stocks).
QCOM Stock Summary
- With a market capitalization of $153,148,800,000, QUALCOMM INC has a greater market value than 98.66% of US stocks.
- Of note is the ratio of QUALCOMM INC's sales and general administrative expense to its total operating expenses; only 7.5% of US stocks have a lower such ratio.
- As for revenue growth, note that QCOM's revenue has grown -18.96% over the past 12 months; that beats the revenue growth of merely 14.3% of US companies in our set.
- Stocks with similar financial metrics, market capitalization, and price volatility to QUALCOMM INC are VRTX, AMAT, MU, LRCX, and REGN.
- Visit QCOM's SEC page to see the company's official filings. To visit the company's web site, go to www.qualcomm.com.
QCOM Valuation Summary
- QCOM's price/earnings ratio is 20.5; this is 23.08% lower than that of the median Technology stock.
- QCOM's EV/EBIT ratio has moved down 9.6 over the prior 243 months.
Below are key valuation metrics over time for QCOM.
Stock | Date | P/S | P/B | P/E | EV/EBIT |
---|---|---|---|---|---|
QCOM | 2023-12-08 | 4.1 | 6.9 | 20.5 | 19.3 |
QCOM | 2023-12-07 | 4.1 | 6.9 | 20.5 | 19.3 |
QCOM | 2023-12-06 | 4.0 | 6.7 | 20.0 | 18.9 |
QCOM | 2023-12-05 | 4.1 | 6.7 | 20.1 | 19.0 |
QCOM | 2023-12-04 | 4.0 | 6.7 | 20.0 | 18.9 |
QCOM | 2023-12-01 | 4.0 | 6.7 | 20.0 | 18.8 |
QCOM Growth Metrics
- Its 2 year cash and equivalents growth rate is now at -14.64%.
- The year over year net cashflow from operations growth rate now stands at -5.09%.
- The 5 year net income to common stockholders growth rate now stands at -9.52%.
The table below shows QCOM's growth in key financial areas (numbers in millions of US dollars).
Date | Revenue | Operating Cash Flow | Net Income to Common Stock |
---|---|---|---|
2022-12-31 | 42,958 | 10,134 | 11,772 |
2022-09-30 | 44,200 | 9,096 | 12,936 |
2022-06-30 | 42,141 | 8,727 | 12,861 |
2022-03-31 | 39,265 | 9,205 | 11,158 |
2021-12-31 | 36,036 | 9,418 | 9,986 |
2021-09-30 | 33,566 | 10,536 | 9,043 |
QCOM's Quality Factors
The “Quality” component of the POWR Ratings focuses on 31 different factors of a companies fundamentals and operational strength. Here are some key insights as we drill into the specifics of these quality attributes.- QCOM has a Quality Grade of B, ranking ahead of 94.24% of graded US stocks.
- QCOM's asset turnover comes in at 0.868 -- ranking 61st of 208 Electronic Equipment stocks.
- WOLF, NSYS, and ITI are the stocks whose asset turnover ratios are most correlated with QCOM.
The table below shows QCOM's key quality metrics over time.
Period | Asset Turnover | Gross Margin | ROIC |
---|---|---|---|
2021-09-26 | 0.868 | 0.575 | 0.380 |
2021-06-27 | 0.874 | 0.598 | 0.386 |
2021-03-28 | 0.825 | 0.600 | 0.339 |
2020-12-27 | 0.777 | 0.602 | 0.305 |
2020-09-27 | 0.708 | 0.607 | 0.263 |
2020-06-28 | 0.614 | 0.570 | 0.165 |
QCOM Price Target
For more insight on analysts targets of QCOM, see our QCOM price target page. And for a list of of all stocks sorted by upside potential based on analyst target price, see our Top Price Target page.
Average Price Target | $183.16 | Average Broker Recommendation | 1.49 (Moderate Buy) |
Qualcomm Inc. (QCOM) Company Bio
Qualcomm Inc. develops and licenses wireless technology. It also engages in designing chips for mobile phones. The company is also the world's largest wireless chip vendor, supplying many premier handset makers with leading-edge processors. The company has operations in more than 30 countries around the globe, including Brazil, China, France, Germany, India, Indonesia, Japan, Mexico, South Korea, the United Kingdom, and the United States. Qualcomm’s products have applications in a variety of industries such as audio, automotive, mobile computing, networking, and smart phones. As of 2020, the company employs over 41,000 individuals worldwide and had 23.5 billion US dollars in revenue. Qualcomm is headquartered in San Diego, California and Steven Mollenkopf serves as Chief Executive Officer.
Latest QCOM News From Around the Web
Below are the latest news stories about QUALCOMM INC that investors may wish to consider to help them evaluate QCOM as an investment opportunity.
7 Megatrend Stocks to Buy for a Mighty Start to 2024Megatrend stocks benefit from exposure to real growth opportunities that have the potential to create massive gains with time. |
The 3 Hottest 5G Stocks to Watch in 2024With the 5G services market set for unprecedented growth over the next decade, investors cannot ignore the three hottest 5G stocks for 2024. |
Telecom Titans: 3 Stocks Dialing Up Success in the 5G EraInvestors seeking exposure to telecom stocks should consider these companies that are actively involved in 5G infrastructure. |
The 5G Future: 3 Stocks Leading the Next Communication RevolutionCommunications is one of the most dynamic industries out there, get ahead of its advancements with these communication stocks. |
How AI boom will benefit these nine chipmakers in 2024Here are the chip companies that have piqued investor interest going into 2024. |
QCOM Price Returns
1-mo | 9.87% |
3-mo | 19.46% |
6-mo | 56.39% |
1-year | 40.54% |
3-year | 36.14% |
5-year | 226.14% |
YTD | 16.00% |
2023 | 35.07% |
2022 | -38.58% |
2021 | 22.25% |
2020 | 77.08% |
2019 | 60.76% |
QCOM Dividends
Ex-Dividend Date | Type | Payout Amount | Change | ||||||
---|---|---|---|---|---|---|---|---|---|
Loading, please wait... |
Continue Researching QCOM
Want to do more research on Qualcomm Inc's stock and its price? Try the links below:Qualcomm Inc (QCOM) Stock Price | Nasdaq
Qualcomm Inc (QCOM) Stock Quote, History and News - Yahoo Finance
Qualcomm Inc (QCOM) Stock Price and Basic Information | MarketWatch
Loading social stream, please wait...