Qualcomm Inc. (QCOM): Price and Financial Metrics
GET POWR RATINGS... FREE!
QCOM POWR Grades
- Value is the dimension where QCOM ranks best; there it ranks ahead of 80.55% of US stocks.
- QCOM's strongest trending metric is Growth; it's been moving down over the last 177 days.
- QCOM ranks lowest in Growth; there it ranks in the 33rd percentile.
QCOM Stock Summary
- QCOM has a market capitalization of $150,169,160,000 -- more than approximately 98.66% of US stocks.
- QUALCOMM INC's stock had its IPO on December 16, 1991, making it an older stock than 84.36% of US equities in our set.
- Of note is the ratio of QUALCOMM INC's sales and general administrative expense to its total operating expenses; merely 11.73% of US stocks have a lower such ratio.
- Stocks that are quantitatively similar to QCOM, based on their financial statements, market capitalization, and price volatility, are INTC, VRTX, MU, AMAT, and AMD.
- Visit QCOM's SEC page to see the company's official filings. To visit the company's web site, go to www.qualcomm.com.
QCOM Valuation Summary
- QCOM's price/sales ratio is 3.3; this is 26.92% higher than that of the median Technology stock.
- QCOM's price/sales ratio has moved down 5.3 over the prior 243 months.
Below are key valuation metrics over time for QCOM.
Stock | Date | P/S | P/B | P/E | EV/EBIT |
---|---|---|---|---|---|
QCOM | 2023-01-25 | 3.3 | 8.2 | 11.4 | 10.3 |
QCOM | 2023-01-24 | 3.3 | 8.1 | 11.3 | 10.3 |
QCOM | 2023-01-23 | 3.3 | 8.2 | 11.4 | 10.3 |
QCOM | 2023-01-20 | 3.1 | 7.6 | 10.7 | 9.7 |
QCOM | 2023-01-19 | 3.0 | 7.3 | 10.2 | 9.4 |
QCOM | 2023-01-18 | 3.1 | 7.6 | 10.6 | 9.7 |
QCOM Growth Metrics
- Its year over year revenue growth rate is now at 33.51%.
- The 2 year revenue growth rate now stands at 58.7%.
- Its 3 year cash and equivalents growth rate is now at -29.23%.

The table below shows QCOM's growth in key financial areas (numbers in millions of US dollars).
Date | Revenue | Operating Cash Flow | Net Income to Common Stock |
---|---|---|---|
2022-09-30 | 44,200 | 9,096 | 12,936 |
2022-06-30 | 42,141 | 8,727 | 12,861 |
2022-03-31 | 39,265 | 9,205 | 11,158 |
2021-12-31 | 36,036 | 9,418 | 9,986 |
2021-09-30 | 33,566 | 10,536 | 9,043 |
2021-06-30 | 32,576 | 11,200 | 9,204 |
QCOM's Quality Factors
The “Quality” component of the POWR Ratings focuses on 31 different factors of a companies fundamentals and operational strength. Here are some key insights as we drill into the specifics of these quality attributes.- QCOM has a Quality Grade of B, ranking ahead of 94.24% of graded US stocks.
- QCOM's asset turnover comes in at 0.868 -- ranking 61st of 208 Electronic Equipment stocks.
- WOLF, NSYS, and ITI are the stocks whose asset turnover ratios are most correlated with QCOM.
The table below shows QCOM's key quality metrics over time.
Period | Asset Turnover | Gross Margin | ROIC |
---|---|---|---|
2021-09-26 | 0.868 | 0.575 | 0.380 |
2021-06-27 | 0.874 | 0.598 | 0.386 |
2021-03-28 | 0.825 | 0.600 | 0.339 |
2020-12-27 | 0.777 | 0.602 | 0.305 |
2020-09-27 | 0.708 | 0.607 | 0.263 |
2020-06-28 | 0.614 | 0.570 | 0.165 |
QCOM Price Target
For more insight on analysts targets of QCOM, see our QCOM price target page. And for a list of of all stocks sorted by upside potential based on analyst target price, see our Top Price Target page.
Average Price Target | $183.16 | Average Broker Recommendation | 1.49 (Moderate Buy) |
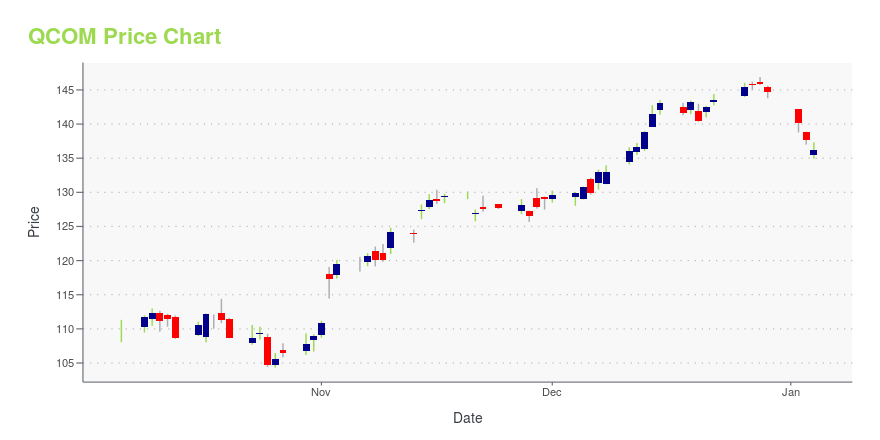
QCOM Stock Price Chart Interactive Chart >
QCOM Price/Volume Stats
Current price | $133.40 | 52-week high | $192.10 |
Prev. close | $133.96 | 52-week low | $101.93 |
Day low | $131.42 | Volume | 6,581,900 |
Day high | $134.89 | Avg. volume | 8,452,339 |
50-day MA | $119.56 | Dividend yield | 2.25% |
200-day MA | $128.83 | Market Cap | 149.03B |
Qualcomm Inc. (QCOM) Company Bio
Qualcomm Inc. develops and licenses wireless technology. It also engages in designing chips for mobile phones. The company is also the world's largest wireless chip vendor, supplying many premier handset makers with leading-edge processors. The company has operations in more than 30 countries around the globe, including Brazil, China, France, Germany, India, Indonesia, Japan, Mexico, South Korea, the United Kingdom, and the United States. Qualcomm’s products have applications in a variety of industries such as audio, automotive, mobile computing, networking, and smart phones. As of 2020, the company employs over 41,000 individuals worldwide and had 23.5 billion US dollars in revenue. Qualcomm is headquartered in San Diego, California and Steven Mollenkopf serves as Chief Executive Officer.
Latest QCOM News From Around the Web
Below are the latest news stories about QUALCOMM INC that investors may wish to consider to help them evaluate QCOM as an investment opportunity.
Semiconductor ETFs In Focus Ahead Of Q4 EarningsThe semiconductor space has been surging over the past three months on improving demand from chip suppliers, data centers, PC manufacturers, and mobile phone producers, as well as China. |
7 Bargain Stocks to Buy as a New Bull Market EmergesThese seven bargain stocks are much more favorable from a risk/reward standpoint than many growth plays in this uncertain market. |
AMD, Nvidia, and 2 More Chip Stocks to Buy for 2023, According to an AnalystOver last two decades, the semiconductor sector has declined in consecutive years only twice, Mizuho says. |
How Virtual Reality for Teachers Can Improve Quality of EducationNORTHAMPTON, MA / ACCESSWIRE / January 25, 2023 / Qualcomm Originally published by Ericsson As someone who was born and raised in Manila, I still sometimes get surprised that it's a place of striking contrasts: high-rise, high-tech skyscrapers ... |
A New Bull Market Might Have Just Begun. Are Nvidia, AMD, and Qualcomm Stocks a Buy Now?These two semiconductor investors are back to discuss how they see the overall semiconductor market after recent movements. |
QCOM Price Returns
1-mo | 21.34% |
3-mo | 14.10% |
6-mo | -8.18% |
1-year | -18.30% |
3-year | 62.16% |
5-year | 129.06% |
YTD | 21.34% |
2022 | -38.58% |
2021 | 22.25% |
2020 | 77.08% |
2019 | 60.76% |
2018 | -7.59% |
QCOM Dividends
Ex-Dividend Date | Type | Payout Amount | Change | ||||||
---|---|---|---|---|---|---|---|---|---|
Loading, please wait... |
Continue Researching QCOM
Want to do more research on Qualcomm Inc's stock and its price? Try the links below:Qualcomm Inc (QCOM) Stock Price | Nasdaq
Qualcomm Inc (QCOM) Stock Quote, History and News - Yahoo Finance
Qualcomm Inc (QCOM) Stock Price and Basic Information | MarketWatch
Loading social stream, please wait...