
QCR Holdings, Inc. (QCRH): Price and Financial Metrics
QCRH Price/Volume Stats
| Current price | $75.95 | 52-week high | $76.97 |
| Prev. close | $75.06 | 52-week low | $45.83 |
| Day low | $74.02 | Volume | 114,655 |
| Day high | $76.97 | Avg. volume | 57,914 |
| 50-day MA | $60.21 | Dividend yield | 0.33% |
| 200-day MA | $56.53 | Market Cap | 1.28B |
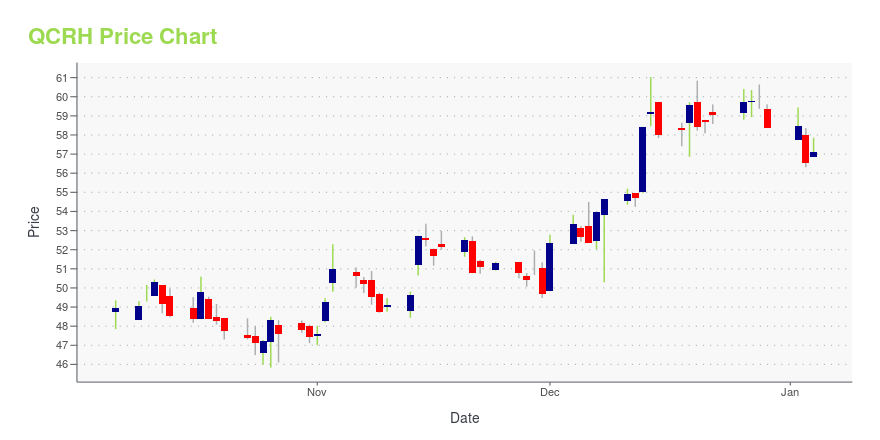
QCRH Stock Price Chart Interactive Chart >
QCR Holdings, Inc. (QCRH) Company Bio
QCR Holdings provides commercial and consumer banking, and trust and asset management services in Iowa. The company was founded in 1993 and is based in Moline, Illinois.
Latest QCRH News From Around the Web
Below are the latest news stories about QCR HOLDINGS INC that investors may wish to consider to help them evaluate QCRH as an investment opportunity.
First Interstate BancSystem (FIBK) Surges 6.3%: Is This an Indication of Further Gains?First Interstate BancSystem (FIBK) was a big mover last session on higher-than-average trading volume. The latest trend in earnings estimate revisions might not help the stock continue moving higher in the near term. |
QCR Holdings, Inc. Announces Closing of First Two Securitizations by Cedar Rapids Bank & TrustSelling $265MM of LIHTC Loans During the Fourth QuarterMOLINE, Ill., Dec. 12, 2023 (GLOBE NEWSWIRE) -- QCR Holdings, Inc. (NASDAQ: QCRH) (the “Company”) today announced the successful closing of two securitizations with a total of $265 million of low-income housing tax credit (“LIHTC”) loans sold by Cedar Rapids Bank & Trust, a wholly-owned subsidiary of the Company. The first securitization consisted of $130 million of tax-exempt LIHTC loans and was part of the Freddie Mac-sponsored M-Series. T |
Those who invested in QCR Holdings (NASDAQ:QCRH) three years ago are up 48%By buying an index fund, you can roughly match the market return with ease. But if you choose individual stocks with... |
QCR Holdings, Inc. Announces a Cash Dividend of $0.06 Per ShareMOLINE, Ill., Nov. 08, 2023 (GLOBE NEWSWIRE) -- QCR Holdings, Inc. (NASDAQ: QCRH) today announced that on November 2, 2023, the Company’s board of directors declared a cash dividend of $0.06 per share payable on January 4, 2024, to holders of common stock of the Company of record on December 15, 2023. About Us QCR Holdings, Inc., headquartered in Moline, Illinois, is a relationship-driven, multi-bank holding company serving the Quad Cities, Cedar Rapids, Cedar Valley, Des Moines/Ankeny and Sprin |
QCR Holdings, Inc. (NASDAQ:QCRH) Q3 2023 Earnings Call TranscriptQCR Holdings, Inc. (NASDAQ:QCRH) Q3 2023 Earnings Call Transcript October 27, 2023 Operator: Greetings and welcome to the QCR Holdings Inc. Earnings Conference Call for the Third Quarter of 2023. Yesterday after market close the company distributed its third quarter earnings press release. If there is anyone on the call who has not received a […] |
QCRH Price Returns
| 1-mo | 32.13% |
| 3-mo | 35.26% |
| 6-mo | 23.60% |
| 1-year | 47.96% |
| 3-year | 61.15% |
| 5-year | 103.92% |
| YTD | 30.35% |
| 2023 | 18.35% |
| 2022 | -10.95% |
| 2021 | 42.13% |
| 2020 | -9.02% |
| 2019 | 37.56% |
QCRH Dividends
| Ex-Dividend Date | Type | Payout Amount | Change | ||||||
|---|---|---|---|---|---|---|---|---|---|
| Loading, please wait... | |||||||||
Continue Researching QCRH
Want to see what other sources are saying about Qcr Holdings Inc's financials and stock price? Try the links below:Qcr Holdings Inc (QCRH) Stock Price | Nasdaq
Qcr Holdings Inc (QCRH) Stock Quote, History and News - Yahoo Finance
Qcr Holdings Inc (QCRH) Stock Price and Basic Information | MarketWatch
Loading social stream, please wait...