
LiveRamp Holdings, Inc. (RAMP): Price and Financial Metrics
RAMP Price/Volume Stats
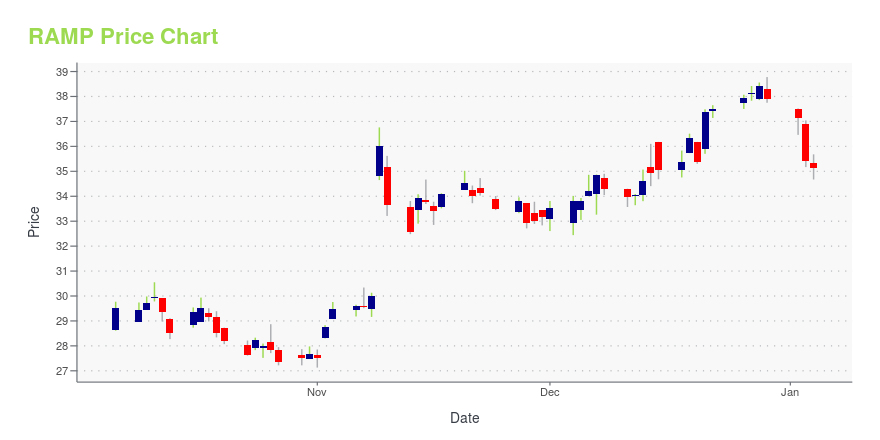
| Current price | $31.99 | 52-week high | $42.66 |
| Prev. close | $32.36 | 52-week low | $22.63 |
| Day low | $31.70 | Volume | 753,400 |
| Day high | $32.33 | Avg. volume | 591,385 |
| 50-day MA | $34.29 | Dividend yield | N/A |
| 200-day MA | $32.98 | Market Cap | 2.10B |
RAMP Stock Price Chart Interactive Chart >
LiveRamp Holdings, Inc. (RAMP) Company Bio
LiveRamp Holdings, Inc. (formerly Acxiom Corporation) operates as an enterprise data, analytics, and software-as-a-service company in the United States, Europe, South America, and the Asia-Pacific. It operates through two segments, Marketing and Data Services, and IT Infrastructure Management. The company was founded in 1969 and is based in Little Rock, Arkansas.
Latest RAMP News From Around the Web
Below are the latest news stories about LIVERAMP HOLDINGS INC that investors may wish to consider to help them evaluate RAMP as an investment opportunity.
The 7.0% return this week takes LiveRamp Holdings' (NYSE:RAMP) shareholders one-year gains to 62%These days it's easy to simply buy an index fund, and your returns should (roughly) match the market. But you can... |
Stocks To Buy And Watch: Digital Ad Recovery Propels 60% Gain For This FirmLeading data onboarding company LiveRamp, a top stock to buy and watch, scored a breakout this week and is now trading within a buy zone. |
LiveRamp Elevates Three Executives to C-Suite to Drive Continued GrowthSAN FRANCISCO, December 14, 2023--LiveRamp (NYSE: RAMP) today announced the promotion of three senior leaders to C-level roles, to accelerate LiveRamp’s recent momentum while continuing to position the company to deliver enduring brand and business value for customers by collaborating responsibly with data. Vihan Sharma was promoted to Chief Revenue Officer, Kimberly Bloomston was promoted to Chief Product Officer, and Travis Clinger was promoted to Chief Connectivity & Ecosystem Officer. |
TripleLift and LiveRamp Expand Partnership to Deliver Best-in-Class Reach by Combining First-Party Publisher and Advertiser DataAd tech platform TripleLift, and data collaboration platform LiveRamp (NYSE: RAMP), announced today an integration of TripleLift Audiences and RampID to give marketers almost limitless and scalable first-party audience solutions. The partnership brings together TripleLift Audiences, which delivers first-party data from publishers, with RampID, LiveRamp's durable, privacy-centric connectivity identifier, to offer lookalike addressability across the open web without relying on cookies, IDFAs, IP a |
Cellebrite (CLBT) and LiveRamp (RAMP) Are Aggressive Growth StocksTwo more names for your aggressive growth stock radar screen. |
RAMP Price Returns
| 1-mo | -4.51% |
| 3-mo | -20.84% |
| 6-mo | 16.92% |
| 1-year | 38.66% |
| 3-year | -36.21% |
| 5-year | -46.19% |
| YTD | -15.55% |
| 2023 | 61.60% |
| 2022 | -51.12% |
| 2021 | -34.49% |
| 2020 | 52.26% |
| 2019 | 24.44% |
Continue Researching RAMP
Want to do more research on LiveRamp Holdings Inc's stock and its price? Try the links below:LiveRamp Holdings Inc (RAMP) Stock Price | Nasdaq
LiveRamp Holdings Inc (RAMP) Stock Quote, History and News - Yahoo Finance
LiveRamp Holdings Inc (RAMP) Stock Price and Basic Information | MarketWatch
Loading social stream, please wait...