Ultragenyx Pharmaceutical Inc. (RARE): Price and Financial Metrics
GET POWR RATINGS... FREE!
RARE POWR Grades
- RARE scores best on the Value dimension, with a Value rank ahead of 64.32% of US stocks.
- The strongest trend for RARE is in Growth, which has been heading up over the past 179 days.
- RARE ranks lowest in Sentiment; there it ranks in the 13th percentile.
RARE Stock Summary
- Of note is the ratio of ULTRAGENYX PHARMACEUTICAL INC's sales and general administrative expense to its total operating expenses; just 13.22% of US stocks have a lower such ratio.
- The ratio of debt to operating expenses for ULTRAGENYX PHARMACEUTICAL INC is higher than it is for about just 9.14% of US stocks.
- RARE's price/sales ratio is 9.26; that's higher than the P/S ratio of 86.92% of US stocks.
- If you're looking for stocks that are quantitatively similar to ULTRAGENYX PHARMACEUTICAL INC, a group of peers worth examining would be EDIT, CYCN, MRUS, FDMT, and TSVT.
- Visit RARE's SEC page to see the company's official filings. To visit the company's web site, go to www.ultragenyx.com.
RARE Valuation Summary
- In comparison to the median Healthcare stock, RARE's price/earnings ratio is 119.91% lower, now standing at -4.4.
- Over the past 110 months, RARE's price/sales ratio has gone NA NA.
Below are key valuation metrics over time for RARE.
Stock | Date | P/S | P/B | P/E | EV/EBIT |
---|---|---|---|---|---|
RARE | 2023-01-30 | 8.8 | 6.4 | -4.4 | -4.0 |
RARE | 2023-01-27 | 8.9 | 6.5 | -4.5 | -4.0 |
RARE | 2023-01-26 | 9.0 | 6.6 | -4.6 | -4.1 |
RARE | 2023-01-25 | 8.9 | 6.5 | -4.5 | -4.0 |
RARE | 2023-01-24 | 8.9 | 6.5 | -4.5 | -4.0 |
RARE | 2023-01-23 | 8.7 | 6.4 | -4.4 | -3.9 |
RARE Growth Metrics
- Its 4 year net income to common stockholders growth rate is now at -62.58%.
- Its year over year revenue growth rate is now at -0.65%.
- The 2 year price growth rate now stands at -8.84%.

The table below shows RARE's growth in key financial areas (numbers in millions of US dollars).
Date | Revenue | Operating Cash Flow | Net Income to Common Stock |
---|---|---|---|
2022-09-30 | 343.37 | -344.467 | -678.046 |
2022-06-30 | 334.314 | -308.771 | -505.938 |
2022-03-31 | 331.946 | -296.87 | -470.204 |
2021-12-31 | 351.406 | -338.695 | -454.025 |
2021-09-30 | 359.559 | -346.803 | -355.578 |
2021-06-30 | 359.382 | -349.121 | -351.425 |
RARE's Quality Factors
The “Quality” component of the POWR Ratings focuses on 31 different factors of a companies fundamentals and operational strength. Here are some key insights as we drill into the specifics of these quality attributes.- RARE has a Quality Grade of D, ranking ahead of 11.33% of graded US stocks.
- RARE's asset turnover comes in at 0.234 -- ranking 185th of 681 Pharmaceutical Products stocks.
- ADMS, AVDL, and QGEN are the stocks whose asset turnover ratios are most correlated with RARE.
The table below shows RARE's key quality metrics over time.
Period | Asset Turnover | Gross Margin | ROIC |
---|---|---|---|
2021-06-30 | 0.234 | 0.955 | -0.414 |
2021-03-31 | 0.225 | 0.956 | -0.267 |
2020-12-31 | 0.194 | 0.977 | -0.277 |
2020-09-30 | 0.174 | 0.973 | -0.420 |
2020-06-30 | 0.140 | 0.962 | -0.540 |
2020-03-30 | 0.116 | 0.959 | -0.769 |
RARE Price Target
For more insight on analysts targets of RARE, see our RARE price target page. And for a list of of all stocks sorted by upside potential based on analyst target price, see our Top Price Target page.
Average Price Target | $143.67 | Average Broker Recommendation | 1.58 (Moderate Buy) |
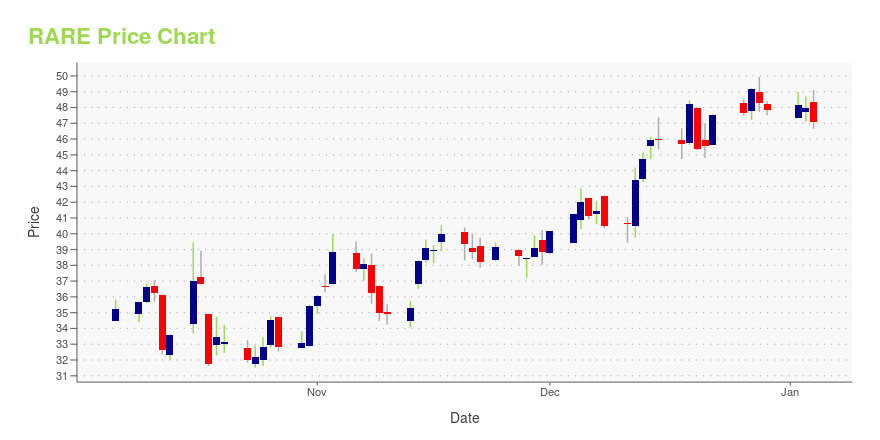
RARE Stock Price Chart Interactive Chart >
RARE Price/Volume Stats
Current price | $47.34 | 52-week high | $85.53 |
Prev. close | $45.24 | 52-week low | $33.36 |
Day low | $45.74 | Volume | 809,090 |
Day high | $47.95 | Avg. volume | 686,472 |
50-day MA | $42.24 | Dividend yield | N/A |
200-day MA | $48.29 | Market Cap | 3.32B |
Ultragenyx Pharmaceutical Inc. (RARE) Company Bio
Ultragenyx is a clinical-stage biopharmaceutical company committed to bringing to market novel products for the treatment of rare and ultra-rare diseases, with a focus on serious, debilitating genetic diseases. The company was founded in 2010 and is based in Novato, California.
Latest RARE News From Around the Web
Below are the latest news stories about ULTRAGENYX PHARMACEUTICAL INC that investors may wish to consider to help them evaluate RARE as an investment opportunity.
Buy These 2 Stocks Before They Jump Over 80%, Say AnalystsThe latest Consumer Price Index (CPI) figures showed that inflation is still easing, having dropped for the 6th consecutive month. The CPI for December rose by 6.5% from the same period a year ago and fell by 0.1% compared to November, thereby meeting Street expectations. There are still areas of concern, though, such as services inflation, which might put a spanner in the works for investors hoping the latest readout will cause the Fed to put the brakes on its rate-hiking endeavors. Additionall |
Can you now get a good deal on Ultragenyx Pharmaceutical Inc.’s shares?In Tuesday’s session, Ultragenyx Pharmaceutical Inc. (NASDAQ:RARE) marked $43.45 per share, up from $40.60 in the previous session. While Ultragenyx Pharmaceutical Inc. has overperformed by 7.02%, investors are advised to look at stock chart patterns for technical insight. Within its last year performance, RARE fell by -41.12%, with highs and lows ranging from $85.53 to […] |
Ultragenyx Pharmaceutical (RARE) presents at 41st Annual J.P. Morgan Healthcare Conference - Slideshow (NASDAQ:RARE)The following slide deck was published by Ultragenyx Pharmaceutical Inc. |
Ultragenyx (RARE) Posts Preliminary '22 Results, Gives '23 ViewUltragenyx (RARE) reports preliminary product revenues for its marketed drugs, Crysvita, Mepsevii and Dojolvi for the full year 2022. The company issues product revenue guidance for 2023. |
Ultragenyx sees 2023 product revenue of $425M-$450MUltragenyx Pharmaceutical (RAREW) on Friday said it sees total product revenue of $425M-$450M in 2023 with the vast majority of it -- $325M-$340M -- coming from Crysvita (burosumab). |
RARE Price Returns
1-mo | 4.00% |
3-mo | 34.22% |
6-mo | -14.86% |
1-year | -32.28% |
3-year | -12.11% |
5-year | -3.51% |
YTD | 2.18% |
2022 | -44.90% |
2021 | -39.25% |
2020 | 224.12% |
2019 | -1.77% |
2018 | -6.25% |
Continue Researching RARE
Want to do more research on Ultragenyx Pharmaceutical Inc's stock and its price? Try the links below:Ultragenyx Pharmaceutical Inc (RARE) Stock Price | Nasdaq
Ultragenyx Pharmaceutical Inc (RARE) Stock Quote, History and News - Yahoo Finance
Ultragenyx Pharmaceutical Inc (RARE) Stock Price and Basic Information | MarketWatch
Loading social stream, please wait...