Republic Bancorp, Inc. - (RBCAA): Price and Financial Metrics
GET POWR RATINGS... FREE!
RBCAA POWR Grades
- RBCAA scores best on the Sentiment dimension, with a Sentiment rank ahead of 96.16% of US stocks.
- The strongest trend for RBCAA is in Momentum, which has been heading up over the past 179 days.
- RBCAA's current lowest rank is in the Growth metric (where it is better than 50.84% of US stocks).
RBCAA Stock Summary
- Equity multiplier, or assets relative to shareholders' equity, comes in at 7.43 for Republic Bancorp Inc; that's greater than it is for 85.87% of US stocks.
- With a year-over-year growth in debt of -33.1%, Republic Bancorp Inc's debt growth rate surpasses only 12.4% of about US stocks.
- Shareholder yield, a measure of how much is returned to shareholders via dividends and share repurchases, for RBCAA comes in at 26.47% -- higher than that of 93.74% of stocks in our set.
- Stocks with similar financial metrics, market capitalization, and price volatility to Republic Bancorp Inc are FMAO, LSBK, NBTB, BRKL, and ABCB.
- RBCAA's SEC filings can be seen here. And to visit Republic Bancorp Inc's official web site, go to www.republicbank.com.
RBCAA Valuation Summary
- In comparison to the median Financial Services stock, RBCAA's price/sales ratio is 191.67% higher, now standing at 3.5.
- RBCAA's price/earnings ratio has moved down 3.5 over the prior 243 months.
- Over the past 243 months, RBCAA's price/sales ratio has gone up 0.1.
Below are key valuation metrics over time for RBCAA.
Stock | Date | P/S | P/B | P/E | EV/EBIT |
---|---|---|---|---|---|
RBCAA | 2017-10-19 | 3.9 | 1.3 | 16.7 | 22.1 |
RBCAA | 2016-11-25 | 4.1 | 1.3 | 17.9 | 23.4 |
RBCAA | 2013-01-16 | 1.5 | 0.8 | 3.9 | 6.2 |
RBCAA | 2011-12-16 | 1.8 | 1.0 | 5.1 | 8.4 |
RBCAA | 2011-03-01 | 1.7 | 1.0 | 5.8 | 11.2 |
RBCAA | 2010-01-13 | 1.9 | 1.1 | 8.9 | 19.8 |
RBCAA Growth Metrics
- The 4 year revenue growth rate now stands at 62.98%.
- The year over year price growth rate now stands at 41.32%.
- The 3 year cash and equivalents growth rate now stands at 74.35%.

The table below shows RBCAA's growth in key financial areas (numbers in millions of US dollars).
Date | Revenue | Operating Cash Flow | Net Income to Common Stock |
---|---|---|---|
2021-12-31 | 292.645 | 99.431 | 86.789 |
2021-09-30 | 284.027 | 94.539 | 90.34 |
2021-06-30 | 288.625 | 74.669 | 90.72 |
2021-03-31 | 289.098 | 55.517 | 82.602 |
2020-12-31 | 288.09 | 68.434 | 83.246 |
2020-09-30 | 289.454 | 99.365 | 88.658 |
RBCAA's Quality Factors
The “Quality” component of the POWR Ratings focuses on 31 different factors of a companies fundamentals and operational strength. Here are some key insights as we drill into the specifics of these quality attributes.- RBCAA has a Quality Grade of C, ranking ahead of 56.88% of graded US stocks.
- RBCAA's asset turnover comes in at 0.046 -- ranking 107th of 428 Banking stocks.
- GFED, WVFC, and CBU are the stocks whose asset turnover ratios are most correlated with RBCAA.
The table below shows RBCAA's key quality metrics over time.
Period | Asset Turnover | Gross Margin | ROIC |
---|---|---|---|
2021-06-30 | 0.046 | 1 | 0.019 |
2021-03-31 | 0.046 | 1 | 0.017 |
2020-12-31 | 0.047 | 1 | 0.016 |
2020-09-30 | 0.048 | 1 | 0.018 |
2020-06-30 | 0.047 | 1 | 0.017 |
2020-03-31 | 0.049 | 1 | 0.017 |
RBCAA Price Target
For more insight on analysts targets of RBCAA, see our RBCAA price target page. And for a list of of all stocks sorted by upside potential based on analyst target price, see our Top Price Target page.
Average Price Target | $59.00 | Average Broker Recommendation | 1.5 (Moderate Buy) |
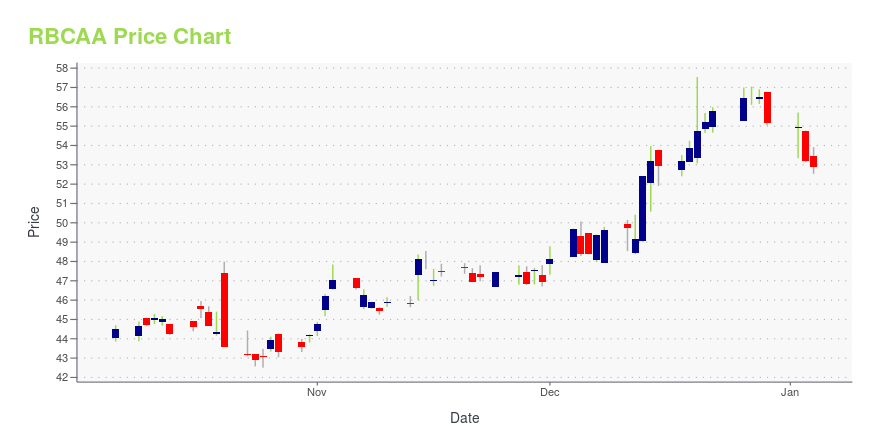
RBCAA Stock Price Chart Interactive Chart >
RBCAA Price/Volume Stats
Current price | $44.83 | 52-week high | $57.62 |
Prev. close | $44.21 | 52-week low | $41.41 |
Day low | $44.40 | Volume | 19,300 |
Day high | $45.15 | Avg. volume | 20,964 |
50-day MA | $44.07 | Dividend yield | 3.08% |
200-day MA | $49.15 | Market Cap | 896.56M |
Republic Bancorp, Inc. - (RBCAA) Company Bio
Republic Bancorp provides banking services to individuals and businesses in Kentucky, Indiana, Florida, Tennessee, and Ohio. The company was founded in 1974 and is based in Louisville, Kentucky.
Latest RBCAA News From Around the Web
Below are the latest news stories about Republic Bancorp Inc that investors may wish to consider to help them evaluate RBCAA as an investment opportunity.
Republic Bancorp GAAP EPS of $0.84 beats by $0.04, revenue of $43.68MRepublic Bancorp press release (RBCAA): Q4 GAAP EPS of $0.84 beats by $0.04.Revenue of $43.68M (-12.0% Y/Y). |
Republic Bancorp, Inc. Finishes 2021 with Fourth Quarter Net Income of $16.8 Million and Full Year Net Income of $86.8 MillionLOUISVILLE, Ky., January 28, 2022--Republic Bancorp, Inc. Finishes 2021 with Fourth Quarter Net Income of $16.8 Million and Full Year Net Income of $86.8 Million |
Republic Bancorp, Inc. Increases Its Common Stock Cash Dividends Paid for the 24th Consecutive YearLOUISVILLE, Ky., January 26, 2022--Republic Bancorp, Inc. Increases its Common Stock Cash Dividends Paid for the 24th Consecutive Year |
Valeo Financial Advisors, LLC Buys Vanguard S&P 500 ETF, Vanguard Intermediate-Term ...Investment company Valeo Financial Advisors, LLC (Current Portfolio) buys Vanguard S&P 500 ETF, Vanguard Intermediate-Term Government Bond ETF, Merchants Bancorp, SPDR SERIES TRUST, Midland States Bancorp Inc, sells Vanguard FTSE Emerging Markets ETF, iShares MSCI Emerging Markets ETF, Convey Health Solutions Holdings Inc, Republic Bancorp Inc, Alibaba Group Holding during the 3-months ended 2021Q4, according to the most recent filings of the investment company, Valeo Financial Advisors, LLC. |
Republic Bancorp (NASDAQ:RBCAA) Lowered to Market Perform at Hovde GroupHovde Group downgraded shares of Republic Bancorp (NASDAQ:RBCAA) from an outperform rating to a market perform rating in a research note published on Wednesday, Price Targets.com reports. The brokerage currently has $57.00 price target on the banks stock. Shares of Republic Bancorp stock opened at $53.69 on Wednesday. Republic Bancorp has a 52-week low of [] |
RBCAA Price Returns
1-mo | 3.37% |
3-mo | -3.52% |
6-mo | -14.39% |
1-year | 0.39% |
3-year | 1.17% |
5-year | 47.06% |
YTD | -11.17% |
2021 | 44.53% |
2020 | -20.18% |
2019 | 23.71% |
2018 | 4.17% |
2017 | -1.55% |
RBCAA Dividends
Ex-Dividend Date | Type | Payout Amount | Change | ||||||
---|---|---|---|---|---|---|---|---|---|
Loading, please wait... |
Continue Researching RBCAA
Want to see what other sources are saying about Republic Bancorp Inc's financials and stock price? Try the links below:Republic Bancorp Inc (RBCAA) Stock Price | Nasdaq
Republic Bancorp Inc (RBCAA) Stock Quote, History and News - Yahoo Finance
Republic Bancorp Inc (RBCAA) Stock Price and Basic Information | MarketWatch
Loading social stream, please wait...