Regency Centers Corporation (REG): Price and Financial Metrics
REG Price/Volume Stats
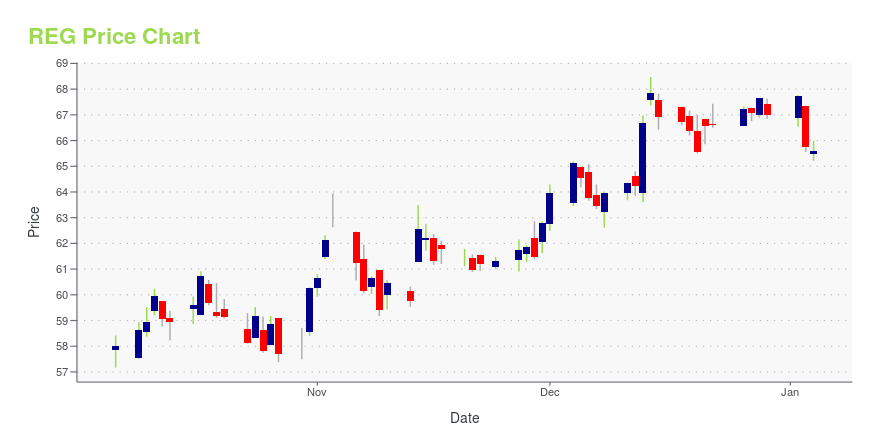
Current price | $57.25 | 52-week high | $68.56 |
Prev. close | $56.99 | 52-week low | $53.17 |
Day low | $56.48 | Volume | 262,363 |
Day high | $57.41 | Avg. volume | 939,454 |
50-day MA | $62.65 | Dividend yield | 4.37% |
200-day MA | $61.81 | Market Cap | 9.79B |
REG Stock Price Chart Interactive Chart >
REG POWR Grades
- Stability is the dimension where REG ranks best; there it ranks ahead of 79.68% of US stocks.
- REG's strongest trending metric is Value; it's been moving down over the last 177 days.
- REG ranks lowest in Value; there it ranks in the 17th percentile.
REG Stock Summary
- Of note is the ratio of REGENCY CENTERS CORP's sales and general administrative expense to its total operating expenses; just 8.63% of US stocks have a lower such ratio.
- For REG, its debt to operating expenses ratio is greater than that reported by 90.84% of US equities we're observing.
- The volatility of REGENCY CENTERS CORP's share price is greater than that of merely 4.47% US stocks with at least 200 days of trading history.
- If you're looking for stocks that are quantitatively similar to REGENCY CENTERS CORP, a group of peers worth examining would be UDR, EPRT, UE, KIM, and CTO.
- Visit REG's SEC page to see the company's official filings. To visit the company's web site, go to www.regencycenters.com.
REG Valuation Summary
- In comparison to the median Real Estate stock, REG's price/earnings ratio is 8.18% higher, now standing at 29.1.
- REG's price/sales ratio has moved up 3.3 over the prior 243 months.
Below are key valuation metrics over time for REG.
Stock | Date | P/S | P/B | P/E | EV/EBIT |
---|---|---|---|---|---|
REG | 2023-09-20 | 8.5 | 1.8 | 29.1 | 28.4 |
REG | 2023-09-19 | 8.5 | 1.8 | 29.1 | 28.4 |
REG | 2023-09-18 | 8.5 | 1.8 | 29.1 | 28.4 |
REG | 2023-09-15 | 8.7 | 1.8 | 29.7 | 28.9 |
REG | 2023-09-14 | 8.8 | 1.8 | 29.9 | 29.0 |
REG | 2023-09-13 | 8.6 | 1.8 | 29.4 | 28.6 |
REG Growth Metrics
- Its 5 year net income to common stockholders growth rate is now at 97.02%.
- Its 5 year price growth rate is now at -33.32%.
- Its 3 year cash and equivalents growth rate is now at 317.75%.

The table below shows REG's growth in key financial areas (numbers in millions of US dollars).
Date | Revenue | Operating Cash Flow | Net Income to Common Stock |
---|---|---|---|
2022-12-31 | 1,224.022 | 655.815 | 482.865 |
2022-09-30 | 1,206.429 | 679.152 | 455.461 |
2022-06-30 | 1,209.815 | 661.858 | 485.289 |
2022-03-31 | 1,194.891 | 662.918 | 475.983 |
2021-12-31 | 1,166.161 | 659.388 | 361.411 |
2021-09-30 | 1,127.697 | 633.007 | 332.039 |
REG's Quality Factors
The “Quality” component of the POWR Ratings focuses on 31 different factors of a companies fundamentals and operational strength. Here are some key insights as we drill into the specifics of these quality attributes.- REG has a Quality Grade of C, ranking ahead of 63.35% of graded US stocks.
- REG's asset turnover comes in at 0.098 -- ranking 217th of 443 Trading stocks.
- KRG, BEN, and STOR are the stocks whose asset turnover ratios are most correlated with REG.
The table below shows REG's key quality metrics over time.
Period | Asset Turnover | Gross Margin | ROIC |
---|---|---|---|
2021-06-30 | 0.098 | 0.697 | 0.026 |
2021-03-31 | 0.092 | 0.686 | 0.021 |
2020-12-31 | 0.091 | 0.692 | 0.014 |
2020-09-30 | 0.093 | 0.702 | 0.014 |
2020-06-30 | 0.096 | 0.714 | 0.016 |
2020-03-31 | 0.101 | 0.726 | 0.018 |
REG Price Target
For more insight on analysts targets of REG, see our REG price target page. And for a list of of all stocks sorted by upside potential based on analyst target price, see our Top Price Target page.
Average Price Target | $71.88 | Average Broker Recommendation | 1.66 (Moderate Buy) |
Regency Centers Corporation (REG) Company Bio
Regency Centers Corporation is a real estate investment trust based in Jacksonville, Florida and is one of the largest operators of shopping centers with grocery stores as anchor tenants. As of October 21, 2020, the company owned 415 properties comprising 56 million square feet of space. Notable properties owned by the company include Serramonte Center and a 30% interest in Village District. (Source:Wikipedia)
Latest REG News From Around the Web
Below are the latest news stories about REGENCY CENTERS CORP that investors may wish to consider to help them evaluate REG as an investment opportunity.
Regency Centers Invites You to Join Its Third Quarter 2023 Earnings Conference CallJACKSONVILLE, Fla., Sept. 29, 2023 (GLOBE NEWSWIRE) -- Regency Centers Corporation (The “Company”) (NASDAQ: REG) will announce its Third Quarter 2023 earnings results on Thursday, November 2, 2023, after the market closes. The Company’s earnings release and supplemental information package will be posted on the Investor Relations section of the Company’s website – investors.regencycenters.com. The Company will host an earnings conference call on Friday, November 3, 2023, at 11:00 a.m. ET. Third |
Pinterest upgraded, Dollar General downgraded: Wall Street's top analyst callsToday's top research calls for upgrade, downgrade and initiate on stocks, as compiled by The Fly. |
Regency Centers (REG) Up 10% in 6 Months: Will the Trend Last?Regency (REG) is poised to benefit from its high-quality open-air shopping center portfolio and focus on necessity, service, convenience and value retailers serving the essential needs of communities. |
Deep Dive Into Regency Centers Corp's Dividend Performance and SustainabilityRegency Centers Corp(NASDAQ:REG) recently announced a dividend of $0.65 per share, payable on 2023-10-04, with the ex-dividend date set for 2023-09-13. As investors look forward to this upcoming payment, the spotlight also shines on the company's dividend history, yield, and growth rates. Using the data from GuruFocus, let's deep dive into Regency Centers Corps dividend performance and assess its sustainability. |
Regency Centers to Present at the BofA Securities 2023 Global Real Estate ConferenceJACKSONVILLE, Fla., Sept. 06, 2023 (GLOBE NEWSWIRE) -- Regency Centers Corporation (“Regency” or the “Company”) (Nasdaq: REG) today announced that Mike Mas, Executive Vice President and Chief Financial Officer, is scheduled to make a presentation at the 2023 BofA Securities 2023 Global Real Estate Conference (the “Conference”) on Wednesday, September 13, 2023, at 2:10 pm ET. To access the Company’s live presentation, use the webcast registration link below. Regency Centers PresentationDate:Wedne |
REG Price Returns
1-mo | N/A |
3-mo | -6.72% |
6-mo | N/A |
1-year | 6.48% |
3-year | 60.90% |
5-year | 11.41% |
YTD | -5.42% |
2022 | -13.59% |
2021 | 71.41% |
2020 | -23.86% |
2019 | 11.43% |
2018 | -12.00% |
REG Dividends
Ex-Dividend Date | Type | Payout Amount | Change | ||||||
---|---|---|---|---|---|---|---|---|---|
Loading, please wait... |
Continue Researching REG
Want to see what other sources are saying about Regency Centers Corp's financials and stock price? Try the links below:Regency Centers Corp (REG) Stock Price | Nasdaq
Regency Centers Corp (REG) Stock Quote, History and News - Yahoo Finance
Regency Centers Corp (REG) Stock Price and Basic Information | MarketWatch
Loading social stream, please wait...